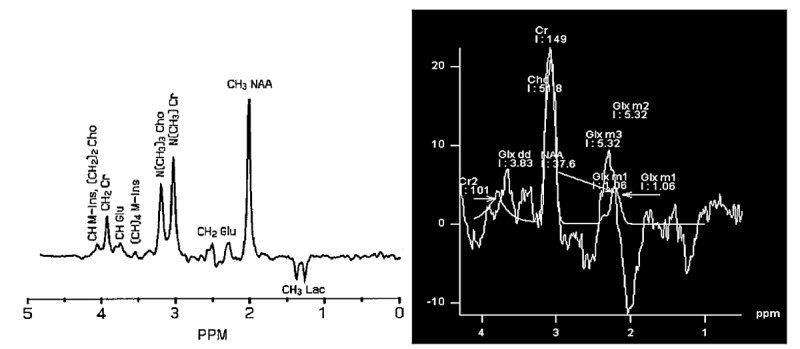
Figure4.

Left image: the expected spectrum of the test phantom provided by 1.5 T Siemens MRI, TR=1500 ms, voxel size= 8 cm3 and TE=144 ms [12]. Right image: the spectrum of the produced phantom with the same metabolite concentration as the test phantom with our 1.5 T Siemens MRI, TR=1500 ms, voxel size= 8 cm3 and TE=144 ms.
