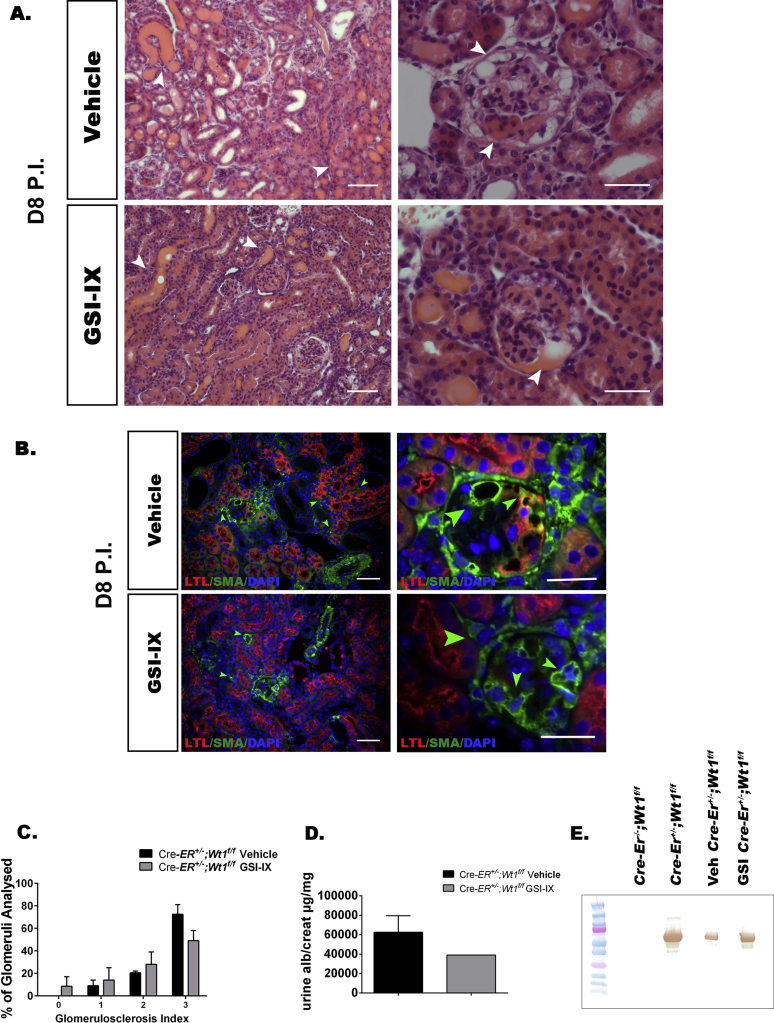
Figure S13.
Gamma secretase inhibition (GSI-IX) in late Wt1 glomerulopathy does not rescue disease (A-E). (A) Shown are representative micrographs of hematoxylin and eosin–stained kidney sections of GSI-IX-treated CAGG-CreERTM+/−;Wt1f/f and vehicle (dimethylsulfoxide)-treated CAGG-CreERTM+/−;Wt1f/f mutant mice treated the evening of day (D) 7 postinduction (PI) (established disease with renal impairment). Vehicle-treated mice (top panel) exhibit global glomerulosclerosis with hyaline material in the tubules. Top left image represents a lower-power image of the glomeruli and tubules, with hyaline material in the tubules (indicated by white arrows, bar = 50 μm); top right panel shows a high-power image of the glomerulus with global glomerulosclerosis (indicated by white arrows, bar = 25 μm). Glomeruli of GSI-IX–treated mice (bottom panel) show the same degree of glomerulosclerosis as do vehicle-treated mice, with global glomerulosclerosis. Bottom left image represents a lower-power image of the glomeruli and tubules, with hyaline-filled tubules (indicated by white arrows, bar = 50 μm); bottom right panel shows a high-power image of the glomerulus, with severe glomerulosclerosis (indicated by white arrows, bar = 25 μm). (B) Shown are merged micrographs of kidney sections following double immunofluorescence labeling of vehicle- and GSI-IX–treated CAGG-CreERTM+/−;Wt1f/f kidney tissue sections with α-smooth muscle actin (SMA) (Alexa Fluor 488–conjugated secondary antibody) and anti-Lotus tetragonolobus lectin (LTL) (Alexa Fluor 594–conjugated secondary antibody). Bars = 50 μm. Top panel represents lower power image (left) of the tubules and glomeruli in vehicle-treated mutants, highlighting SMA between the tubules (green arrows), indicating tubulointerstitial disease; higher-power (right) shows SMA-positive staining in dilated capillary loop (green arrow). Bottom panel: low-power image (left) of the tubules and glomeruli in GSI-treated mutants, showing SMA in peritubular interstitium (green arrows); higher-power (right) image highlights the glomerulus with SMA expression within the glomerular tuft (green arrows). (C) Quantitative graph of glomerulosclerosis index (score 0–3: 0, <25%; 1, 25%–50%; 2, 50%–75%; 3, >75% sclerosis). Vehicle-treated mutants (n = 62 glomeruli, n = 2 mice) versus GSI-IX–treated mutants (n = 66 glomeruli, n = 2 mice). Bars represent the mean of each group, error bars represent the SEMs. Score 0: 0% versus 8.5 ± 8.5%, P = 0.42, Student t-test; score 1: 9 ± 5% versus 28.5 ± 3.5%, P = 0.09, Student t-test; score 2: 20.5 ± 1.5% versus 28 ± 11%, P = 0.57, Student t-test; score 3: 72.5 ± 8.5% versus 49 ± 9%, P = 0.20, Student t-test. (D) Quantitative graph showing mean urine albumin-creatinine ratio in vehicle-treated (n = 3) versus GSI-IX–treated (n = 1) CAGG-CreERTM+/−;Wt1f/f transgenic mice. Bars represent the mean, error bars represent the SEMs. (E) Western blot analysis demonstrates albuminuria in D8 PI CAGG-CreERTM+/−;Wt1f/f vehicle-treated CAGG-CreERTM+/−;Wt1f/f and GSI-IX–treated CAGG-CreERTM+/−;Wt1f/f transgenic mice but not in CAGG-CreERTM−/−;Wt1f/f control mice (molecular weight of albumin: 66.5 kDa).

