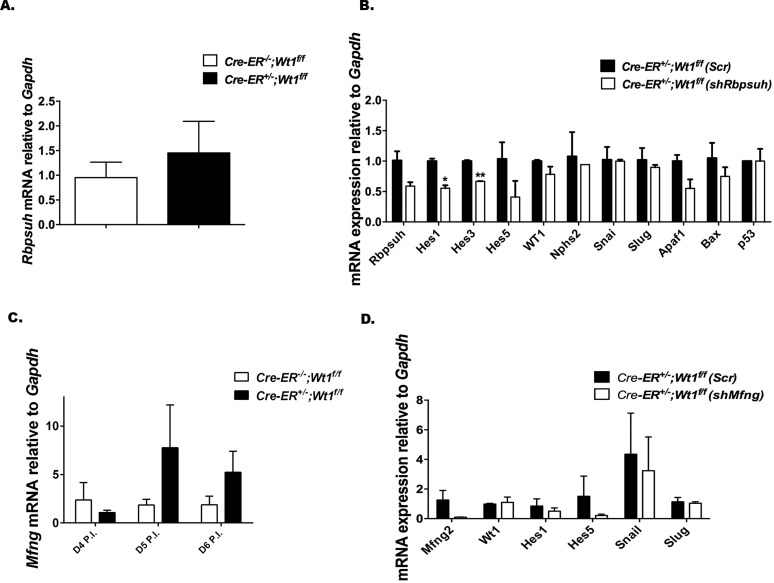
Figure S14.
Manic fringe (Mfng) and Rbpsuh short hairpin RNA (shRNA) knockdown in day (D) 6 postinduction (PI) CAGG-CreERTM−/+;Wt1f/f podocytes results in repression of Notch basic helix loop helix (bHLH) targets (A–D). (A) Relative transcript levels of Rbpsuh (canonical Notch target) in D6 PI primary podocytes of CAGG-CreERTM−/−;Wt1f/f controls (n = 7) versus CAGG-CreERTM−/+;Wt1f/f mutants (n = 10). Bars represent the median level, error bars represent interquartile range (IQRs). Rbpsuh expression is increased in D6 PI CAGG-CreERTM−/+;Wt1f/f mutants versus Cre-negative controls: 0.95 (IQR: 0.79, 1.27) versus 1.45 (IQR: 1.01, 2.09), P = 0.05, Mann-Whitney U test. (B) Relative transcript levels of Rbpsuh, Notch bHLH components, Hes1, Hes3, and Hes5, Snail, Slug (markers of epithelial to mesenchymal transition [EMT]), podocyte-specific transcripts Wt1, Nphs1, and Nphs2 and apoptosis components Apaf1, Bax, and p53 following 48 hours of Rbpsuh shRNA knockdown. Bars represent the mean, error bars represent the SEMs. Scrambled shRNA (Scr) CAGG-CreERTM−/+;Wt1f/f mutants (n = 2) versus shRNA Rbpsuh-CAGG-CreERTM−/+;Wt1f/f mutants (n = 2); Rbpsuh: 1.0 ± 0.15 versus 0.6 ± 0.1, P = 0.12; Hes1: 1.0 ± 0.04 versus 0.6 ± 0.05, *P = 0.02; Hes3: 1.0 ± 0.02 versus 0.7 ± 0.004, **P = 0.002; Hes5: 1.0 ± 0.27 versus 0.4 ± 0.3, P = 0.24; Wt1: 1.0 ± 0.02 versus 0.8 ± 0.13, P = 0.23; Snail: 1.0 ± 0.21 versus 1.0 ± 0.02, P = 0.92; Slug: 1.0 ± 0.2 versus 0.9 ± 0.04, P = 0.61; Apaf1: 1.0 ± 0.1 versus 0.71 ± 0.2, P = 0.31; Bax: 1.1 ± 0.35 versus 0.8 ± 0.2, P = 0.60; p53: 1.0 ± 0.0 versus 0.7 ± 0.2, P = 0.27. Student t-test. (C) Relative transcript levels of Manic fringe in CAGG-CreERTM−/−;Wt1f/f controls versus CAGG-CreERTM−/+;Wt1f/f mutants at D4, D5, and D6 PI. Bars represent the mean, error bars represent the SEMs. D4: Mfng: 2.4 ± 1.8 versus 1.1 ± 0.2, P = 0.44; D5: Mfng: 1.8 ± 0.6 versus 7.8 ± 4.4, P = 0.16; D6: Mfng: 1.9 ± 0.9 versus 5.0 ± 2.4, P = 0.19. Student t-test. (D) Relative transcript levels of Rbpsuh, Notch bHLH components, Hes1, Hes3, Hes5, Snail, Slug (markers of EMT), and podocyte-specific transcript Wt1 following 48 hours of MFng shRNA knockdown. Scrambled shRNA transfected (Scr) CAGG-CreERTM−/+;Wt1f/f (n = 2) versus Manic fringe shRNA (shMfng) transfected CAGG-CreERTM−/+;Wt1f/f (n = 2). Bars represent the mean, error bars represent SEMs. Mfng expression is reduced following shRNA knockdown. Scr versus shMFng: 1.3 ± 0.7 versus 0.1 ± 0.01, P = 0.22. Wt1 transcript levels are equivocal in both groups posttransfection, 1.0 ± 0.1 versus 1.1 ± 0.5, P = 0.78. Notch components, Hes1, and Hes5 are reduced in shRNA Mfng podocytes compared with Scr podocytes. Mean transcript in controls versus shRNA MFng: Hes1: 0.9 ± 0.5 versus 0.5 ± 0.2, P = 0.58; Hes5: 1.5 ± 1.4 versus 0.2 ± 0.1, P = 0.44. EMT marker, Snail is reduced: 4.4 ± 2.8 versus 3.2 ± 2.3, P = 0.79; Slug is similar: 1.1 ± 0.3 versus 1.0 ± 0.1, P = 0.79. Analyzed by Student t-test.

