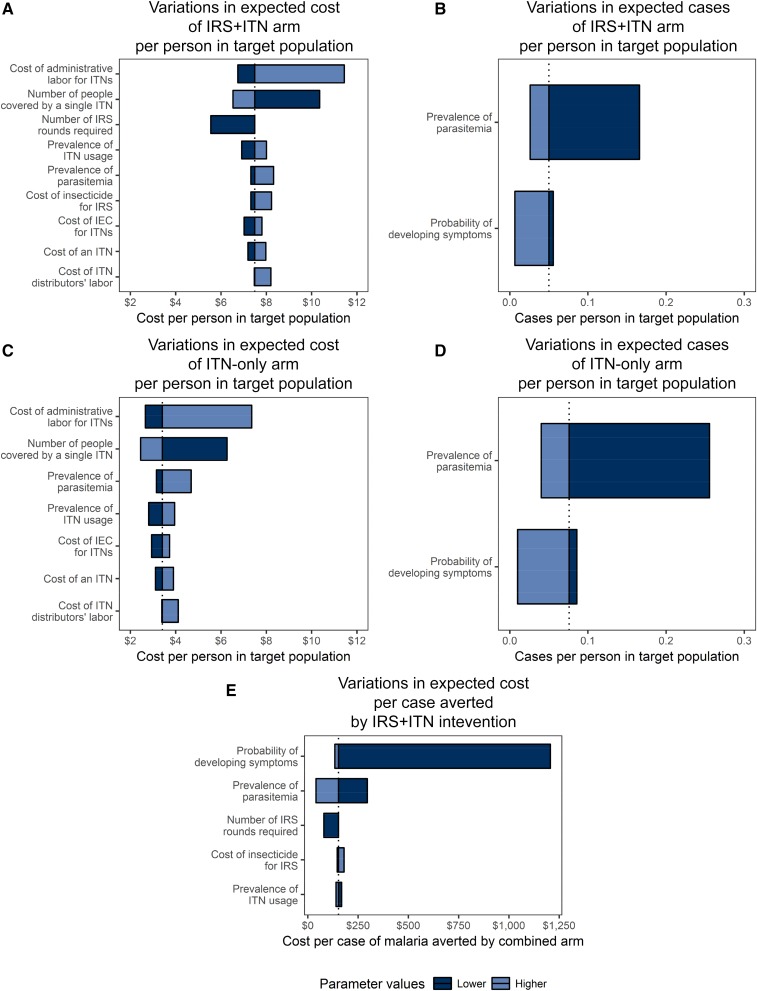
Figure 1.
Tornado diagrams of drivers of variability in expected costs and cases. These tornado diagrams show the most parsimonious combination of parameters that describe at least 95% of the variability in the expected cost and expected cases per person in the population for each intervention arm and in the expected incremental cost per case averted by the combined intervention compared with the insecticide-treated bed net (ITN)-only intervention. Parameters are listed in descending order of the proportion of variability of outcome they describe. Wider bars correspond to greater variation in outcome, and the line in each bar shows the base-case value of the outcome. Dark blue bars correspond to the lower bound of the plausible range of the parameters, and light blue bars correspond to the upper bound. Therefore, a parameter with a dark blue bar on the left and a light blue bar on the right of the base-case value is positively associated with the outcome in question, and a parameter with a dark blue bar on the right and a light blue bar on the left is negatively associated with the outcome in question. This figure appears in color at www.ajtmh.org.

