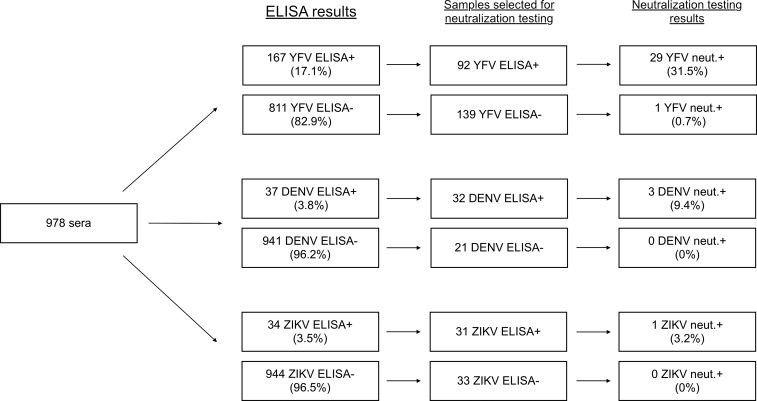
Figure 1.
Enzyme-linked immunosorbent assay (ELISA) and neutralization testing flowchart. Of the total study population of 978 samples, the breakdown by ELISA positivity, selection for neutralization testing, and neutralization results are shown. Percentages of positive samples out of the total number tested using each assay are shown in parentheses. Results are stratified by virus.

