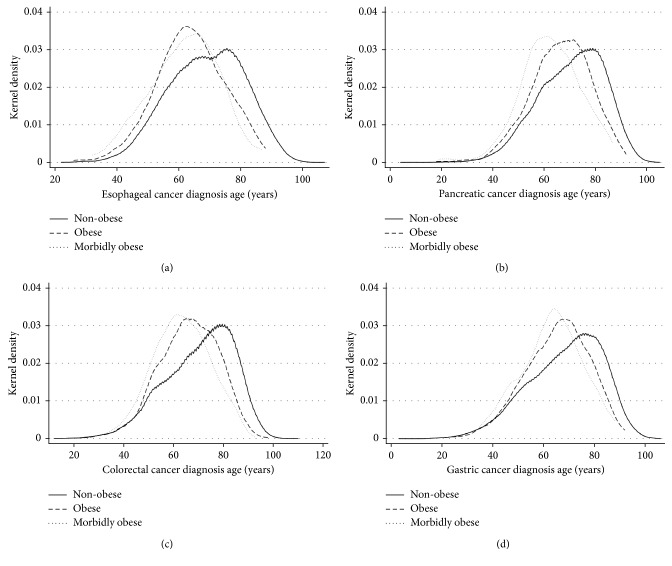
Figure 1.
Kernel density plot of diagnosis age distribution for four gastrointestinal cancers. Kernel density plots of cancer diagnosis age was produced to estimate the relative age distribution of nonobese, obese, and morbidly obese patients who had esophageal (a), pancreatic (b), colorectal (c), and gastric cancer (d). Due to the disparate sample size between BMI groups, kernel density, a nonparametric estimation of the age distribution, was employed to create visual representations of the age distributions to allow comparison.

