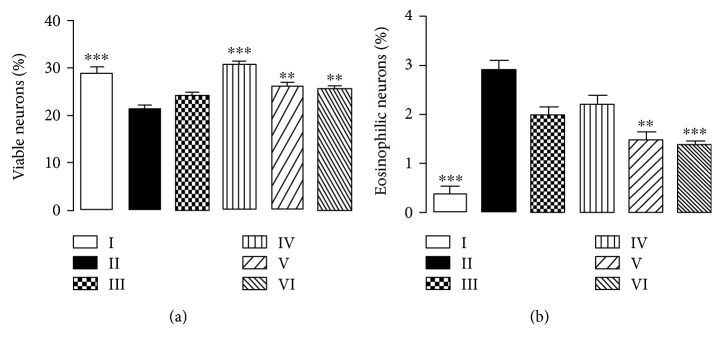
Figure 5.
Relative frequency (%) of viable neurons (a) and necrotic neurons (b) in the CA1 area of the hippocampus. Each column represents mean ± SEM of 10 animals. ∗∗P < 0.001 and ∗∗∗P < 0.0001 in comparison to group II. (I) Control group; (II) aluminium group; (III) quercetin 30 mg/kg; (IV) CHE 10 mg/kg; (V) CHE 100 mg/kg; and (VI) CHE 300 mg/kg.

