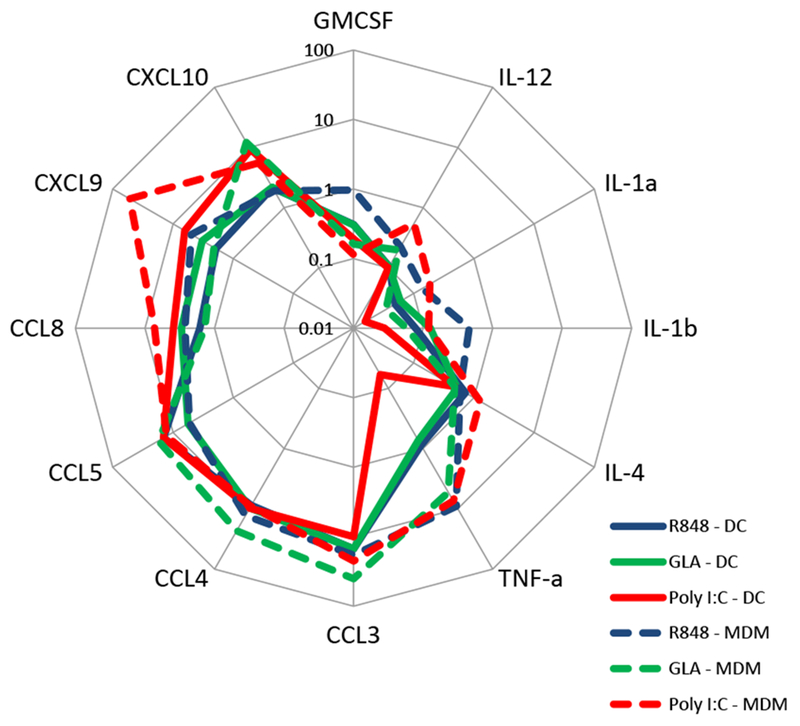
Figure 2. Comparison of TLR responses in MDM and DC.

Luminex data from MDM or DC cultures stimulated with 10 μg/ml R848, GLA and Poly-IC for 24 hours re-plotted on a spider plot for comparison. Points represent mean of n=3 donors.

Luminex data from MDM or DC cultures stimulated with 10 μg/ml R848, GLA and Poly-IC for 24 hours re-plotted on a spider plot for comparison. Points represent mean of n=3 donors.