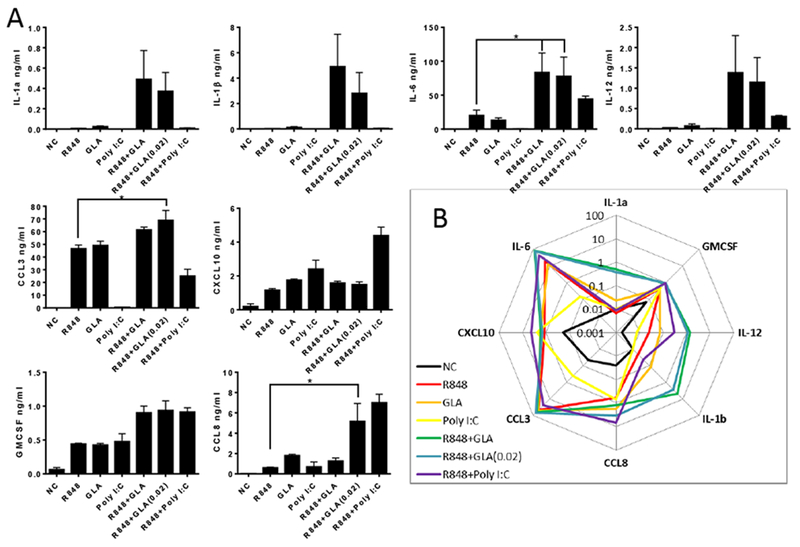
Figure 3. Impact of TLR ligand combinations on induced inflammatory mediator secretion profiles of Dendritic cells.

A. DC were stimulated with 0.5 μg/ml of the relevant TLR ligand (R848, GLA and Poly I:C) or a combination for 24 hours. Mediators were then measured in the culture supernatant. In each graph, cells treated with TLR agonists and untreated samples (NC) are indicated. Bars represent mean +/− SEM of n=3 individual donors. B. Summary of data plotted as spider plot. * p<0.05, measured by one way ANOVA and post test.
