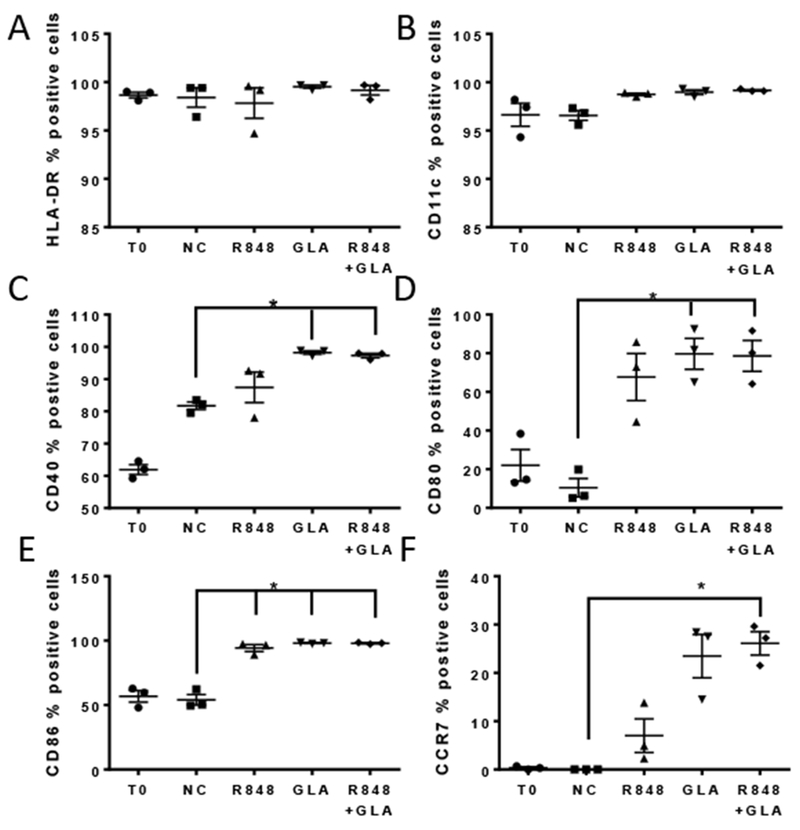
Figure 6. Impact of TLR ligand combinations on DC surface molecule expression profiles.

DC were treated for 24 hours with R848 or GLA alone and in combination, or untreated (Negative Control, NC). Responses were also compared with untreated cells fixed at 0 hours after isolation (T0). Cells were stained and levels of surface expression of multiple surface molecules assessed by flow cytometry: HLA-DR (A), CD11c (B), CD40 (C), CD80 (D), CD86 (E) and CCR7 (F). Each graph shows the mean and SEM of the % of positive cells for each surface molecule, as indicated. ** p<0.01 measured by One way ANOVA and post test.
