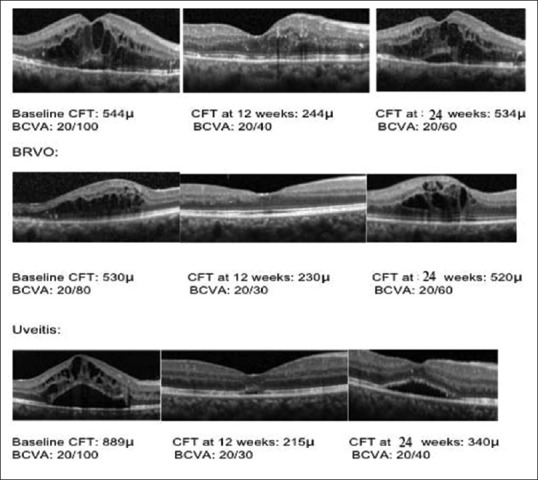
Figure 7.

Optical coherence tomography retinal images from representative diabetic macular edema, branch retinal vein occlusion, and uveitic study eyes at baseline and after treatment with Ozurdex at 12 weeks and at 24 weeks’ follow-up. Best-corrected visual acuity and central foveal thickness values are mentioned
