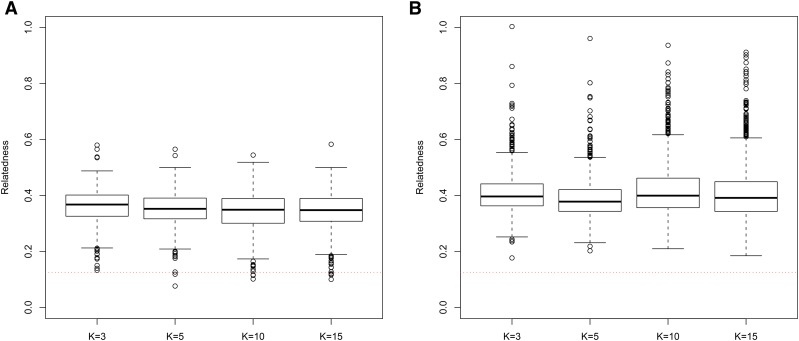
Figure 10.
Distribution of estimates of genetic relatedness between 1000 First Cousin (FC) dyads with increasing degree of subpopulation structure using (a) MC2013, and (b) MC2013WI estimators implemented in InRelate. Number of subpopulations (K) here was varied between K = 3 to K = 15 under the hierarchical island model described in Scenario 1. True relatedness between first cousins = 0.125 is indicated using the dotted red line.

