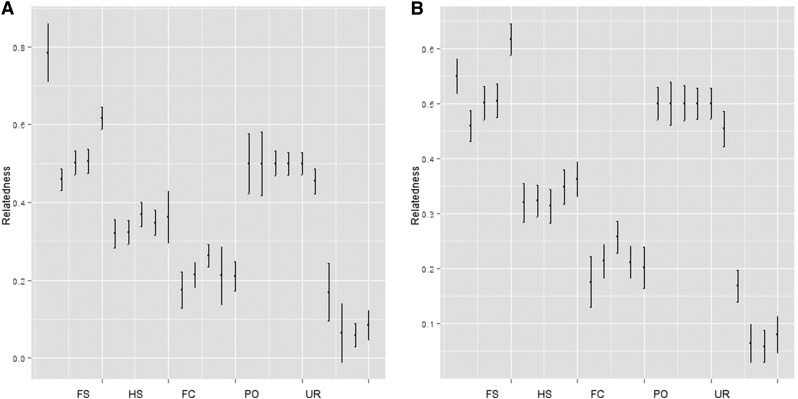
Figure 21.
(a) MC2013 and (b) MC2013WI relatedness estimates and confidence intervals for 5 different relatedness categories, constructed using 200 bootstrap replicates under Scenario 6. The simulation used K = 3 subpopulations, and a total of 5 dyads of FS, HS, PO, FC, and UR individuals were picked.

