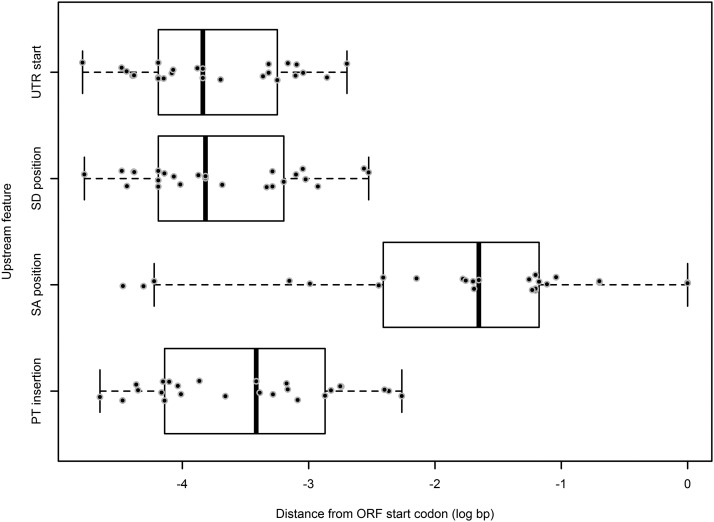
Figure 7.
Scatter and box plot for the locations of the 5′ upstream elements of transcripts into which the promoter trap inserted into 5′-UTR introns in An. stephensi. UTR = untranscribed region, SD = splice donor, SA = splice acceptor, PT = promoter trap. The outer whiskers of each box represent the first and fourth quartiles, the box represents the data from the second to third quartiles, with the black bar within the box representing the median value for the data.

