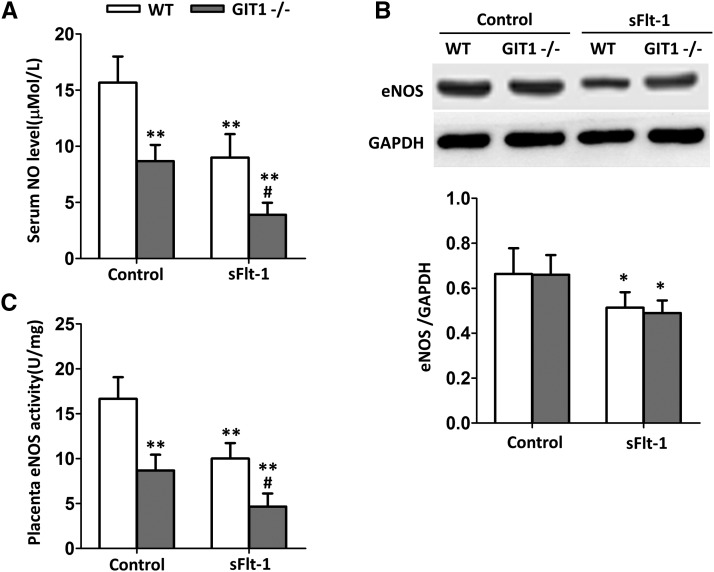
Figure 3.
Serum NO level and placenta eNOS activity were impacted in GIT1−/− mice. (A) Serum NO level (B) Placenta eNOS expression (C) Placenta eNOS activity. The tests were done at day 6 after administration of sFlt-1/Fc (control). N = 6 mice in each experimental group. *P < 0.05, **P < 0.01 vs. WT/control mice, #P < 0.01 vs. WT/ sFlt-1 mice.

