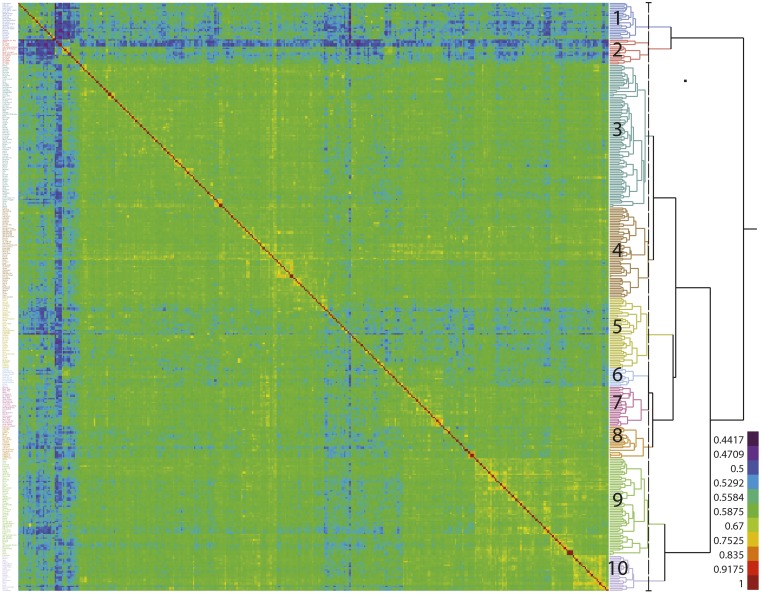
Figure 6.
Heatmap displaying relationships among the 341 lines present in the association panel. The red diagonal represents perfect relationship of each line with itself; the symmetric off-diagonal elements represent relationship for pairs of lines. The blocks of warmer colors on the diagonal show clusters of closely related lines. The adjoining dendrogram illustrates Kinship groups identified in the panel. The details of members of these Kinship groups are present in Table S2.

