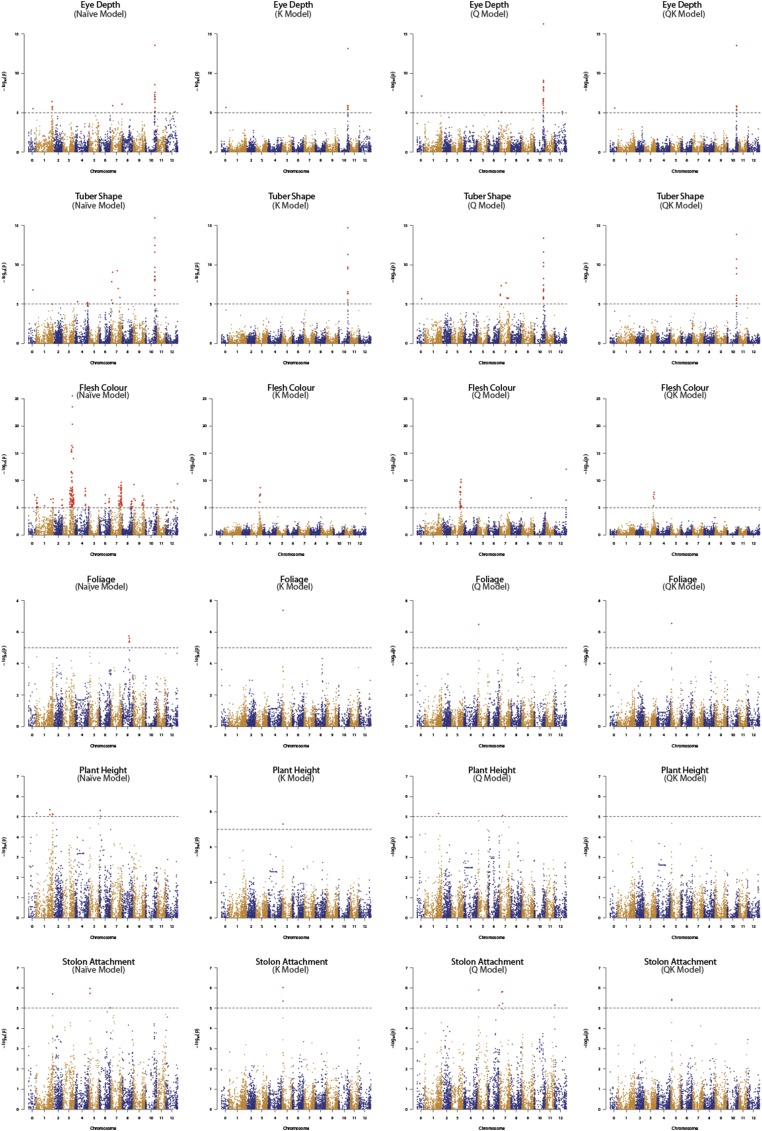
Figure 9.
Comparison of Manhattan plots for Naïve, K, Q and QK models. Significance threshold (black dashed line) is based on the genome-wide false positive rate (α = 0.05) for the Bonferroni correction method and the marker-trait associations (MTAs) crossing the set threshold are depicted in large red dots.

