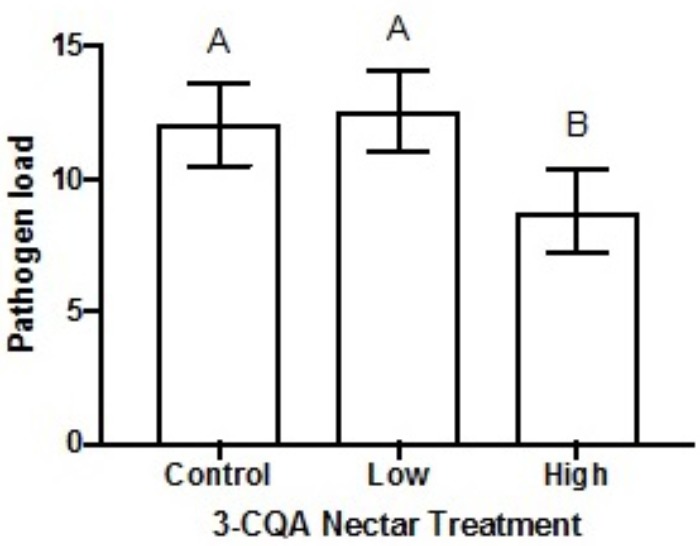
FIGURE 4.

Mean pathogen load of Crithidia (log-transformed Crithidia per mL + 1) in Bombus impatiens workers ( ± SEM) given different dietary concentrations of 3-O-caffeoylquinic acid (3-CQA). The control treatment contained 30% sucrose solution. The low treatment corresponded to 2.8 μM ( = 1 ppm) 3-CQA dissolved in 30% sucrose solution, and the high treatment to 56.5 μM ( = 20 ppm) dissolved in 30% sucrose solution. Different upper-case letters above bars indicate statistically significant differences at p < 0.05.
