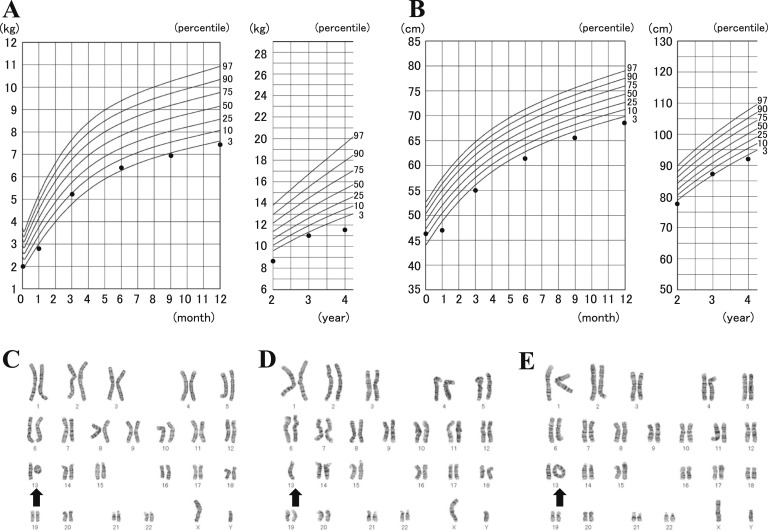
Figure 1.
(A, B) Growth course from birth to 4 years of age in case patient: (A) body weight and (B) height. These data were obtained from a mother and baby notebook for medical and welfare records. The lines represent the standard growth curves of the Japanese population obtained from the website of Ministry of Health, Labor, and Welfare (Japan) (http://www.mhlw.go.jp). (C–E) G-banding analysis was performed using phyto-hemoagglutinin–activated 72-hour cultures. A mosaic pattern comprised three distinct clonal cell populations. (C) Heterozygous ring Chr13, (D) Chr13 monosomy, and (E) heterozygous dicentric ring Chr13 were detected in 70%, 23%, and 7% of the analyzed cells, respectively. The arrow shows Chr13.

