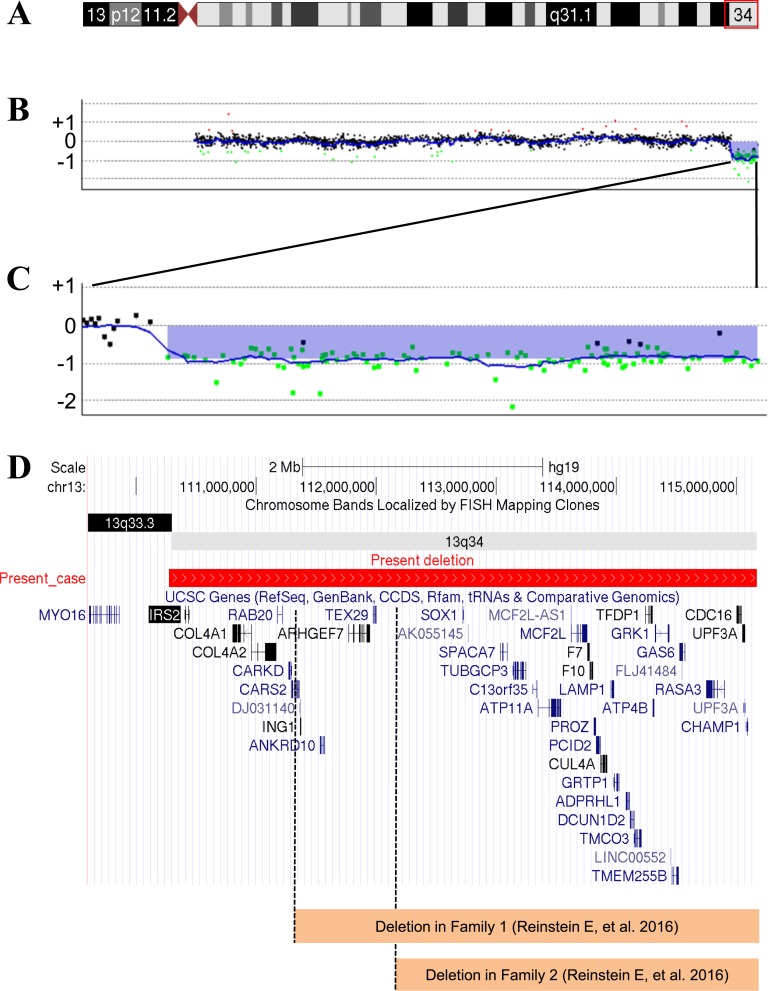
Figure 2.
(A) Chromosome ideogram. The impaired chromosomal region is highlighted. (B) Microarray-based comparative genomic hybridization (aCGH) analysis in Chr13. The aCGH analysis was performed using the Agilent Oligo Microarray Kits 60K (Agilent Technologies, Santa Clara, CA) as described previously [10]. A 4.8-Mb region of hemizygous loss in Chr13q34qter (Chr13: 110,276,126–115,059,020). (C) Magnification of the hemizygous loss region. (D) Forty genes located in the hemizygous loss region of Chr13q34qter. The deleted regions in two families reported by Reinstein et al. [8] are shown. The differences in the hemizygous loss region between our patient and those families include IRS2, COL4A1, COL4A2, RAB20, CARKD, and CARS2. FISH, fluorescence in situ hybridization.

