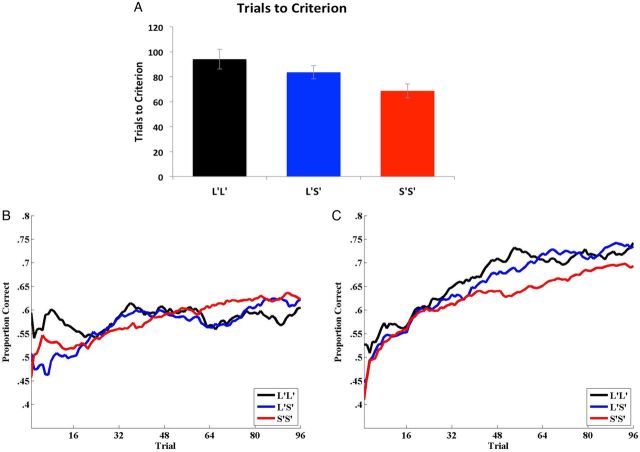
Figure 2.
( A ) Trials to criterion for the 3 tri-allelic serotonin transporter genotype groups from the Experiment 1 reflexive-optimal task. Error bars denote standard error of the mean. ( B ) Average learning curves (based on a sliding 16-trial average window) for the 3 tri-allelic serotonin transporter groups from the Experiment 2 reflexive-optimal task. ( C ) Average learning curves (based on a sliding 16 trial average window) for the 3 tri-allelic serotonin transporter genotype groups from the Experiment 3 reflective-optimal task.

