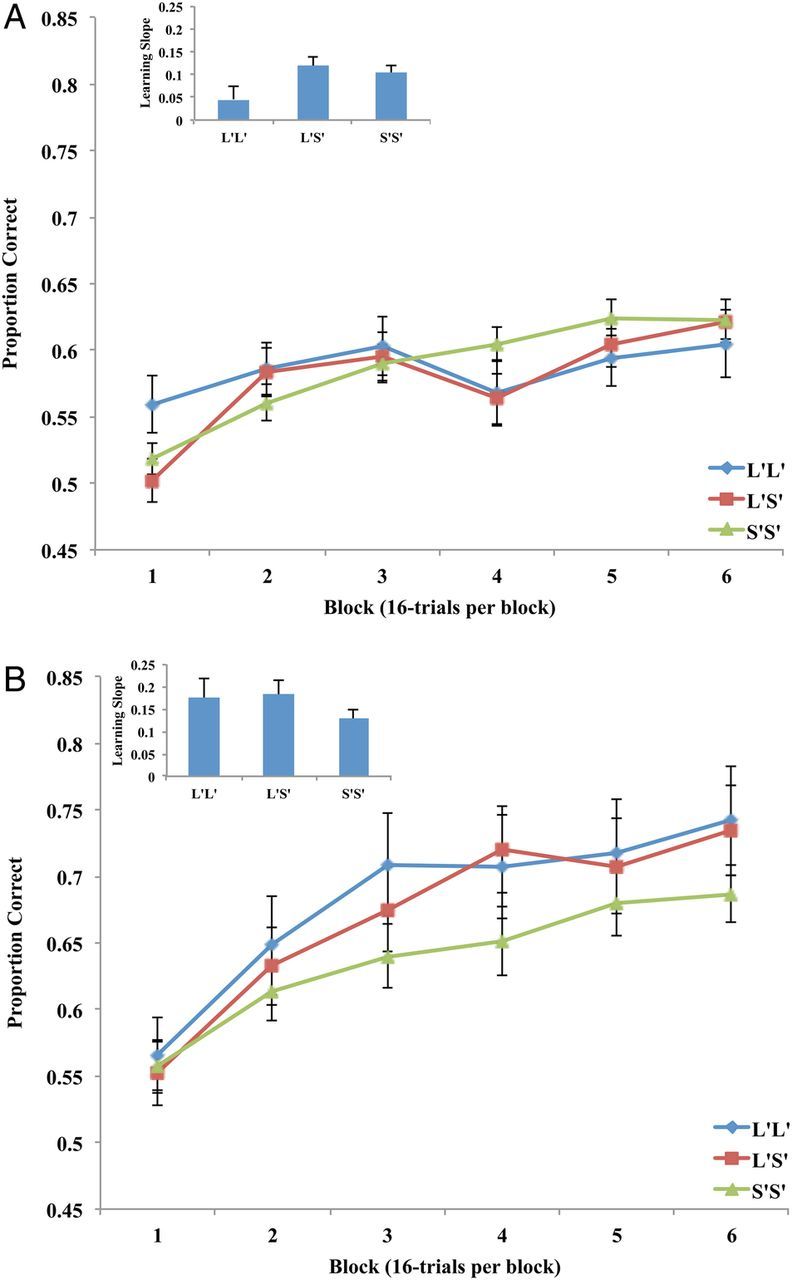
Figure A1.

( A ) Block-by-block proportion correct for the 3 tri-allelic serotonin transporter genotype groups from the Experiment 2 reflexive-optimal task. The inset displays the learning slope data where the learning slope is defined as block 6 accuracy minus block 1 accuracy. Error bars denote standard error of the mean. ( B ) Block-by-block proportion correct for the 3 tri-allelic serotonin transporter genotype groups from the Experiment 3 reflective-optimal task. The inset displays the learning slope data. Error bars denote standard error of the mean.
