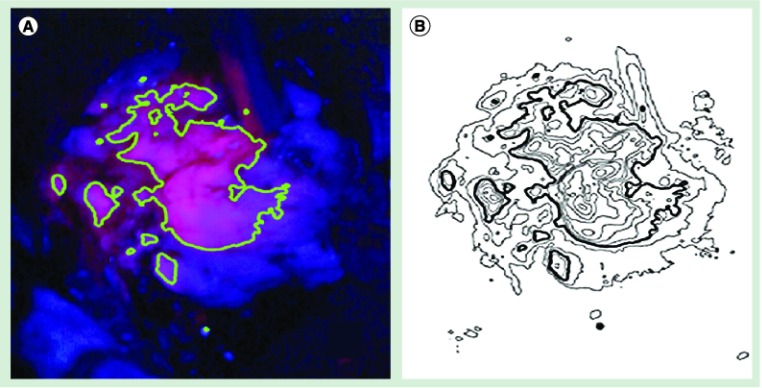
Figure 1. Continuous intraoperative protoporphyrin IX fluorescence signal quantification.
(A) The proposed border between solid and vague fluorescence as seen by the surgeon through the microscope [101]. (B) Intraoperative computerized analysis of the signal intensity from the surface of a glioblastoma multiforme at 630–640 nm. Among many other vectors, the computed signal intensity has to be adjusted for distance to light source and final photon detection, tissue optical properties and spatial reflectance (cavities). Based on these analytical calculations and the results from serial biopsies, estimations for the border between solid and infiltrating tumor can be given.

