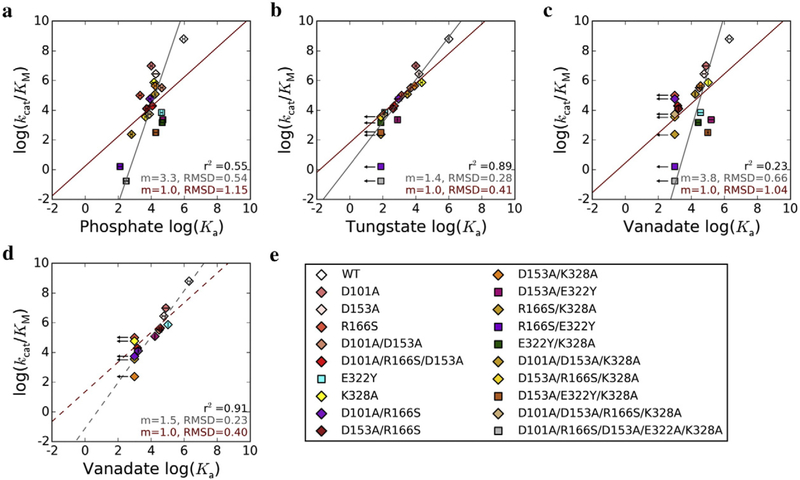
Fig. 3.
Transition state analog behavior of phosphate, tungstate, and vanadate. Correlations between the log of kcat/KM and log of association constant, Ka, for (a) phosphate, (b) tungstate, and (c) vanadate. The linear fit from total least squares regression is shown by the gray lines, and the slope (m) and RMSD are given in gray at the bottom right of each plot. The red lines show linear regressions with the slope constrained to 1, and the m and RMSD values are given in red. The value for the coefficient of determination, r2, is given for each dataset in black. For vanadate, the linear fit was also calculated excluding mutants with the Mg2+ site ablated (d). The AP variants used are listed in (e); mutants with an intact Mg2+ site are represented by diamonds, and those deficient in Mg2+ binding due to the presence of the E322Y mutation are indicated by squares. Arrows denote mutants for which only an upper limit for Ka could be determined; these mutants were not included in the linear fits. Error bars correspond to standard deviations from 2–3 independent experiments.

