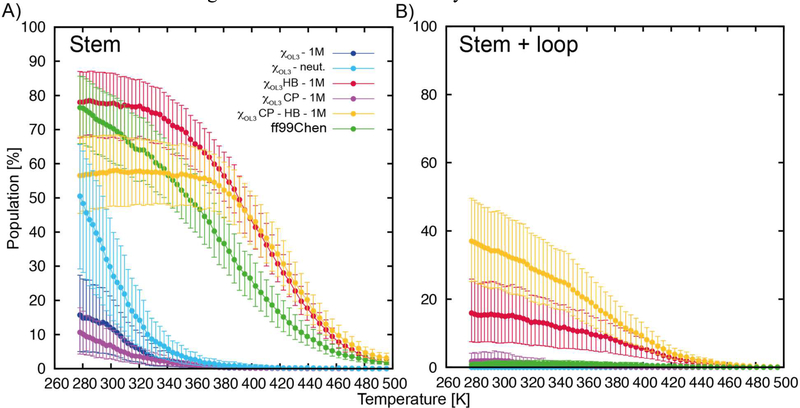
Figure 3.
The population of A) misfolded structures with only folded stem (including the terminal pair) and B) native structures as a function of temperature calculated over all T-REMD 8-mer simulations. The error bars were calculated by bootstraping (using resampling of both time-blocks and coordinate following replicas, see Methods). Note that several simulations shown in the figure are discussed later in the text.

