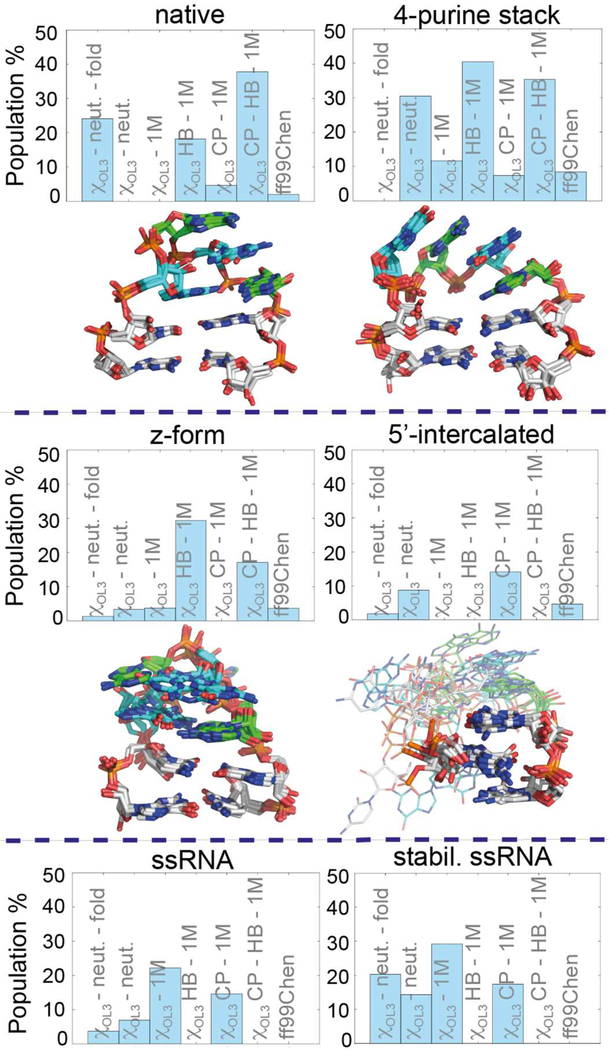
Figure 4.
The most populated GAGA 8-mer TL clusters observed in T-REMD simulations at 300 K based on clustering using the εRMSD metric. The bars present for each particular cluster its populations in the indicated 8-mer T-REMD simulation (note that several simulations are discussed later in the text, see Table 1 for their overview). All graphs, except the two botom-most ones which correspond to ssRNA clusters, are accompanied by the overlapped structures representing cluster centers obtained in all T-REMD simulations. Solid bonds (stick) depict those parts of the structures that are shared in the given cluster while variable parts are shown faded (lines).

