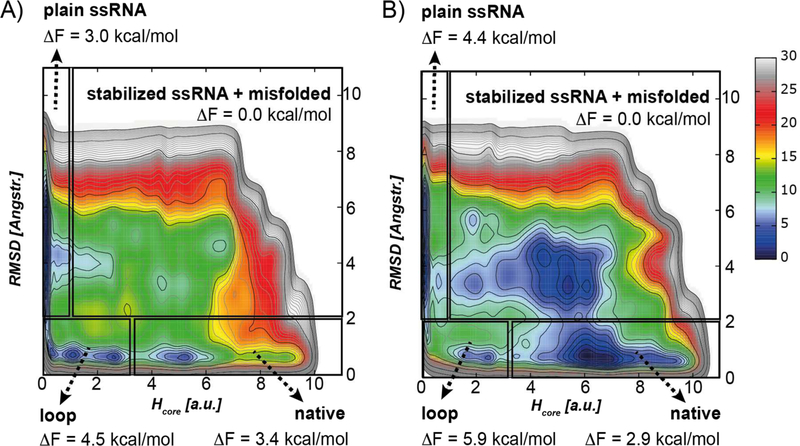
Figure 5.
Free energy surface plots of two independent 3-μs-long WT-MetaD simulations of the GAGA TL using Hcore and RMSD of the TL as CVs. The FES is contoured by 1 kcal/mol (thin lines) and 10 kcal/mol (thick lines). Energies lower than 20 kcal/mol relevant for structural dynamics are colored. The regions depicted on the FES by black boxes correspond to the conformational states populated during the simulations. The free energy values of conformational states were estimated by reweighting scheme.

