Fig. 1.

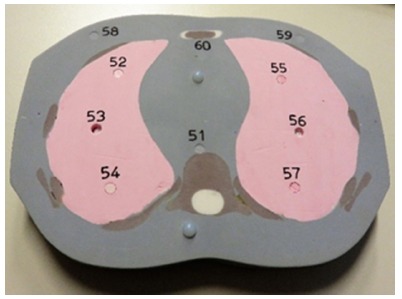
Example of a phantom slice, showing different tissue densities, fixtures and thermoluminescent dosimeter placements with their associated number.

Example of a phantom slice, showing different tissue densities, fixtures and thermoluminescent dosimeter placements with their associated number.