Fig. 3.

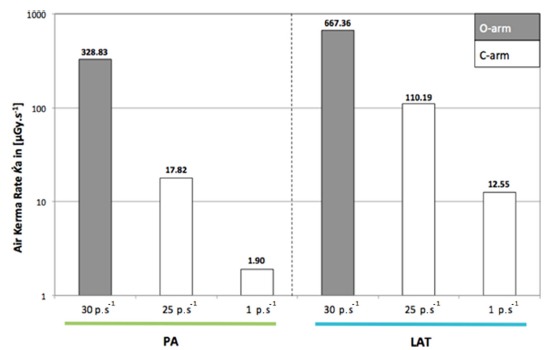
Comparison of dose output (air kerma rate) at the skin surface with the O-arm in 2D mode and with the C-arm for both ten seconds of fluoroscopy (PA, posteroanterior; LAT, lateral).

Comparison of dose output (air kerma rate) at the skin surface with the O-arm in 2D mode and with the C-arm for both ten seconds of fluoroscopy (PA, posteroanterior; LAT, lateral).