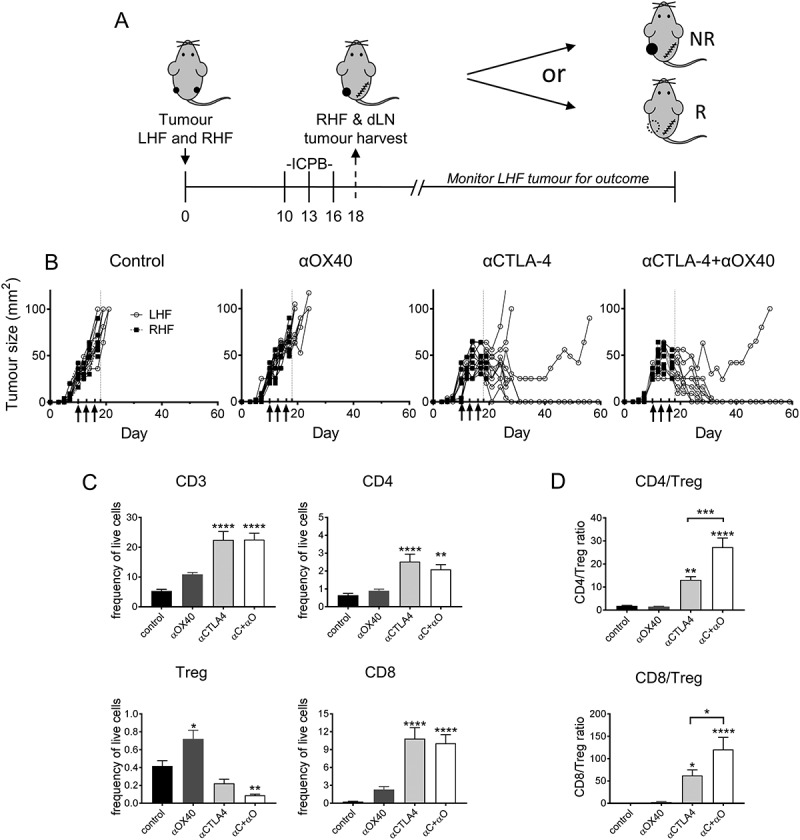
Figure 6.

AB1-HA ICPB dual tumour growth.
Mice were s.c. inoculated on right (RHF) and left (LHF) flank with 5 × 10⁵ AB1 HA cells and immune checkpoint immunotherapy administered i.p. on day 10, 13 and 16 (black arrows). Two days post therapy (day 18, dotted line) RHF tumours and their associated draining lymphnode were harvested for analysis. (A) Dual tumour experimental design. (B) Individual tumour growth curves for both RHF (squares, excised day 18) and LHF (circles) tumours. Data shown: n = 10 mice/group from two independent experiments. (C) Immune cell subset phenotype as a frequency of total live tumour and CD3 T cells. (D) CD8 and CD4 effector T cell to Treg cell ratio. (C D) Data are mean ± SEM; All statistics are one way ANOVA with Bonferroni’s test for multiple comparisons; *p < 0.05, **p < 0.01, ***p < 0.001, ****p < 0.0001 relative to control unless otherwise indicated.
