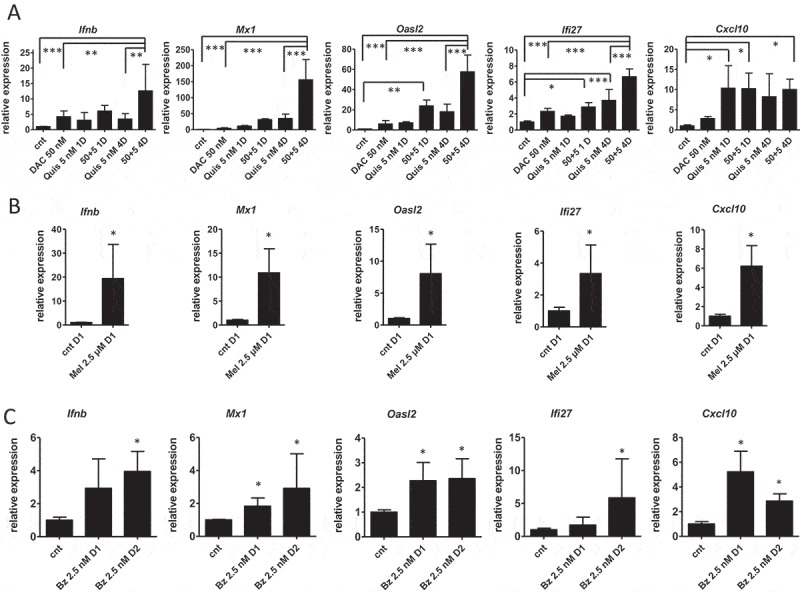
Figure 2.

Type I interferon gene expression is induced upon treatment of 5T33vt cells.
Murine 5T33vt myeloma cells were treated with indicated doses of EMAs for 7 days (A), Mel for 1 day (B) or Bz up to two days (C). Next, RNA was isolated and subjected to qRT-PCR to analyze the expression of a panel of type I IFN genes (n ≥ 4). Bars and error bars represent mean and standard deviation. Statistics were done using One-Way-Anova for multiple group comparisons (A) and Mann-Whitney test for two groups (B, C). *, **, *** indicates p < 0.05, p < 0.001, p < 0.0001. (cnt = control, DAC = decitabine, Quis = Quisinostat, Bz = Bortezomib, Mel = Melphalan, Mtx = Mitoxanthrone, Dx = day x).
