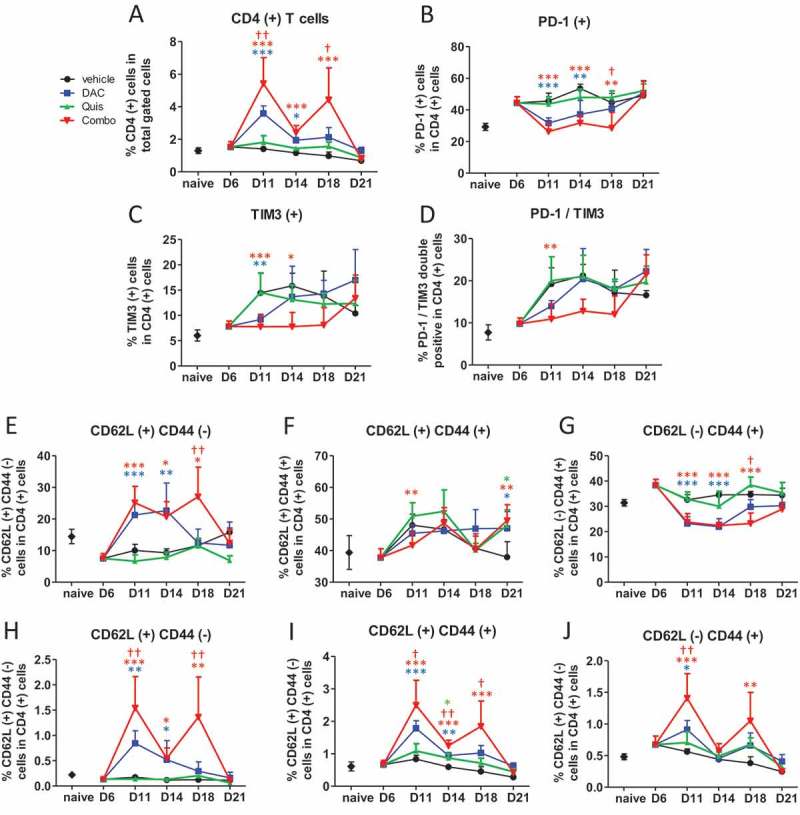
Figure 7.

Effect of in vivo EMA treatment on CD4-positive T cells in the bone marrow.
Mice were treated from day 6 onwards with DAC (0.2 mg/kg daily intraperitoneally). Starting at day 9, mice received Quis (1.5 mg/kg, every other day subcutaneously). At indicated timepoints, mice were euthanized and BM was isolated from the hind legs for FACS analysis. First, debris was excluded using FSC/SSC. Next, cells were selected based on negative staining for near-IR Live/Dead, CD11b, Nk1.1 and B220 (represents total gated cells). Next, TCRb(+)/CD4(+) cells were selected.A: Percentage of TCRb(+)/CD4(+) T cells in the bone marrow of treated mice. B-D: Percentages of PD-1(+) (B), TIM3(+) (C) and PD-1/TIM3 double positive cells (D) within CD4(+) gated cells of treated mice.E-G: Percentages of CD62L(+)/CD44(-) (E), CD62L(+)/CD44(+) (F) and CD62L(-)/CD44(+) cells (G) within CD4(+) T cells.H-J: Percentages of CD62L(+)/CD44(-) (H), CD62L(+)/CD44(+) (I) and CD62L(-)/CD44(+) cells (J) within total gated cells. Dots and error bars represent mean and standard deviation (n = 3 for naive, n = 5–8 per group). Statistics were done using One-Way-Anova. *, ** and *** indicates p < 0.05, p < 0.001 and p < 0.0001, respectively compared to control condition. †, †† and ††† indicates p < 0.05, p < 0.001 and p < 0.0001 compared to respective single agent treatments. (DAC = decitabine, Quis = Quisinostat).
