
Figure 1.
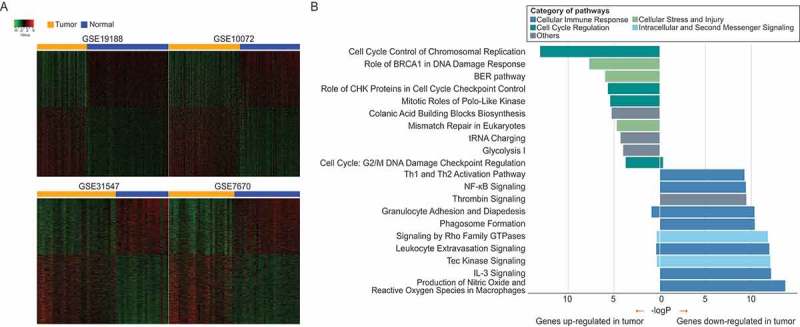
Dysregulated genes and their associated altered pathways in lung adenocarcinoma. (A) Heatmaps for dysregulated genes across four datasets. There are distinct gene expression patterns between tumor and normal tissue samples. (B) Pathway enrichment by dysregulated genes across four datasets. P-values of Fisher’s exact test for pathway enrichments were calculated by Ingenuity Pathway Analysis (IPA).