
Figure 3.
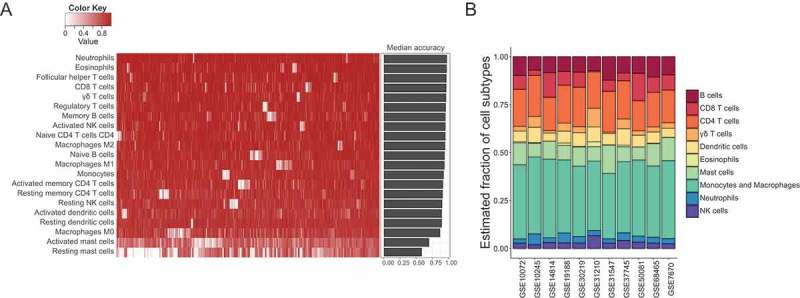
Robustness and accuracy of inferring cell compositions using the refined new signature gene matrix, and the comparability of immune cell compositions among 11 datasets. (A) The accuracy of estimating immune cell fractions in simulated mixture gene expression profiles using the refined new signature gene matrix. Heatmap displayed accuracy for each type of immune cells in 1,000 simulations, and barplot showed the median accuracy for each cell subtype in the simulations. (B) Mean tumor immune cell compositions estimated by CIBERSORT across 11 datasets. These datasets were comparable and had similar tumor immune cell infiltration levels.