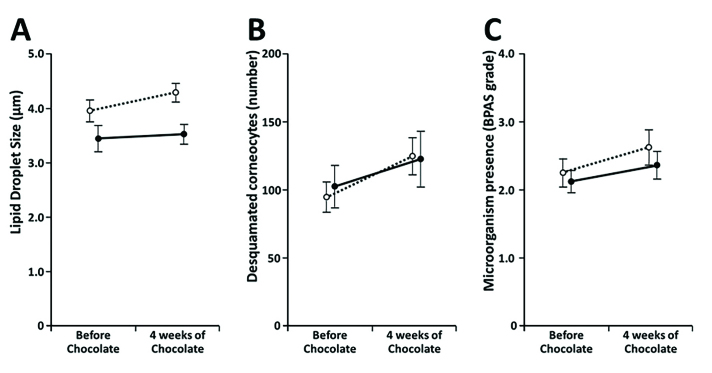
FIGURE 1.
Line charts demonstrating changes of RSSC components during the study. Initial and final time points are shown. Light symbols and dotted lines indicate the young group; black symbols and solid lines indicate the middle-aged group. A) Lipid droplet size in µm (mean±standard errors of the means [SEM]); B) number of desquamated corneocytes per microscope field (mean±SEM); and C) microbial presence per microscope field estimated using Bacterial Presence Assessment Scale (mean±SEM)

