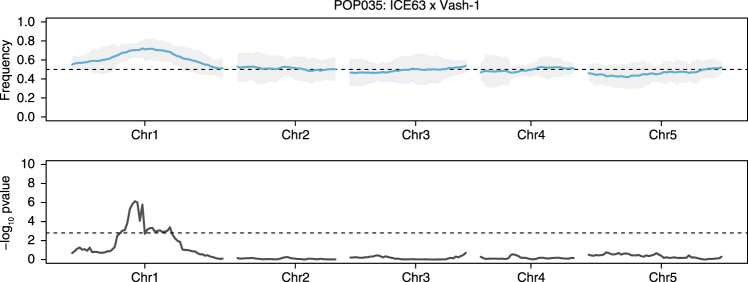
Fig. 2.
A representative F2 population, POP035 (ICE63 × Vash-1), with significant segregation distortion. Distortion in this population was detected with both thresholds (FDR and Z-score outlier). a The beta-binomial modeled allele frequency (blue) across each chromosome is plotted in the upper panel. 95% confidence intervals are indicated by the shaded grey area and the expected frequency of 0.5 is marked by the dashed black line. b The –log10 of the p-value derived from the non-parametric statistical test. The dashed black line in this panel represents the FDR corrected (n = 240) significance threshold (p < 0.05)

