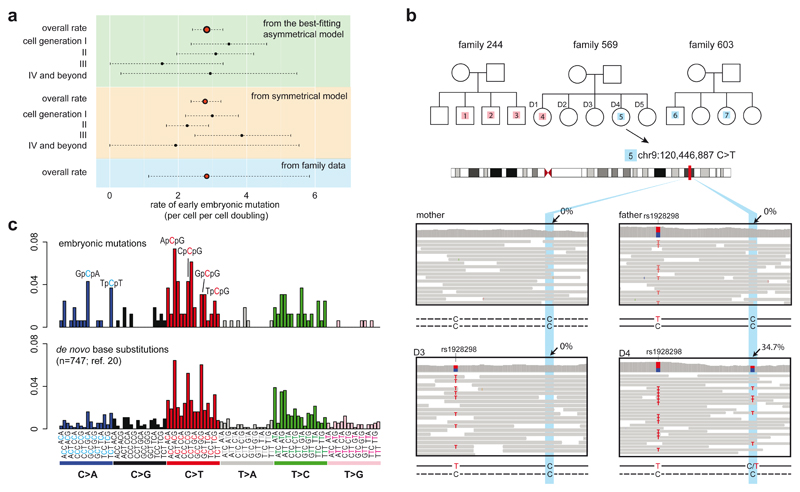
Figure 4. Rates and mutational spectra of early embryonic mutations.
(a) Estimates of early embryonic mutation rates. Best-fitting asymmetric model (top), symmetric model (middle) and family study (bottom) provide similar rate. Broken lines represent 95% confidence intervals from bootstrapping (Methods).
(b) Early embryonic mutations obtained from 3 large families. Each mutation is shown with a number (index) inside the white rectangles or circles in the pedigrees. Sequencing reads are shown for one of the mutations (#5) in family 569.
(c) Similar mutational spectra (ref. 7) obtained from 163 early embryonic mutations and from 747 de novo mutations reported previously (ref. 20).

