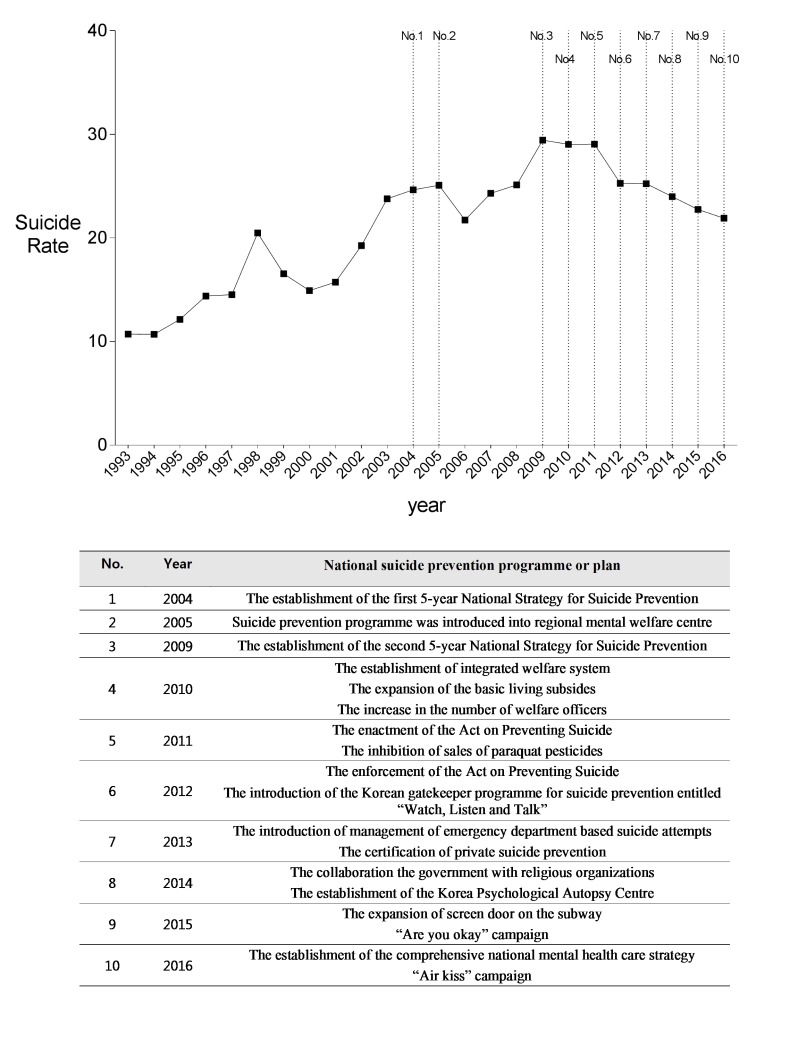
Figure 2.
Implementation of the National Suicide Prevention Programme and Plan. The age-standardised suicide rates are presented as a connected line from 1993 to 2016 are presented as a connected line. Each number represents the year in which the major events related to the National Suicide Prevention programme or Plan occurred.

