Figure 2.
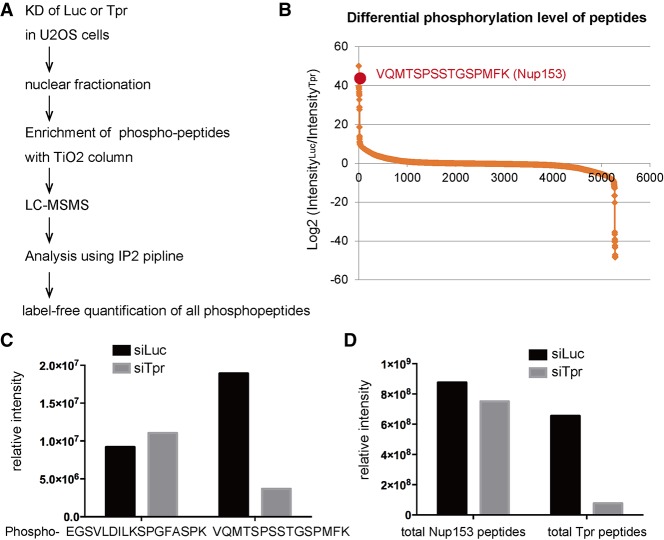
Phosphoproteomics revealed decreased phosphorylation of Nup153 in Tpr knockdown cells. (A) The workflow of phosphoproteomics. (B) Label-free quantification of all of the phosphopeptides obtained (5282 phosphopeptide species) was performed. The intensity based on the peak areas of phosphopeptides was calculated with Skyline pipeline. The intensity in the control knockdown condition was divided by the intensity of the same phosphopeptide in the Tpr knockdown condition to obtain differential phosphorylation levels between two conditions (i.e., decreased phosphorylation in the Tpr knockdown condition). Phosphopeptides were ranked according to log2 ratio. The Y-axis indicates log2 value. (C) Label-free quantification of two different phosphopeptides derived from Nup153 was performed by Skyline. The Y-axis indicates total signal intensity. (D) The amount of total peptides that represents the protein level was analyzed using Skyline pipeline. All of the peptides derived from either Nup153 or Tpr before phosphopeptide enrichment were quantified and summarized. The total abundance of Nup153 peptides did not change in both knockdown conditions, while Tpr peptides were significantly reduced in Tpr knockdown condition.

