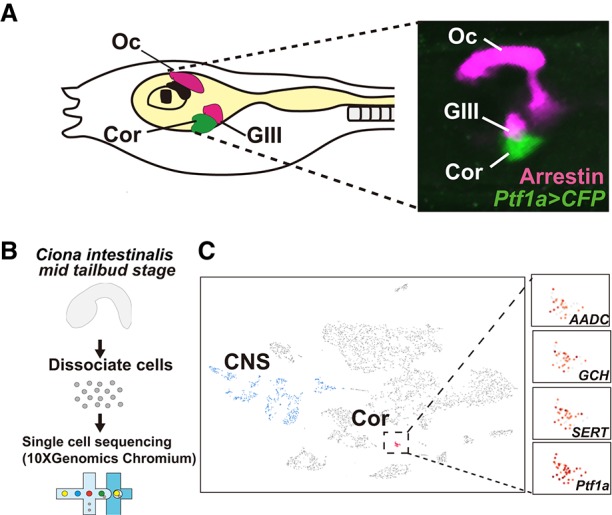
Figure 1.

Whole-embryo single-cell RNA-seq analysis of coronet cells. (A, left) Diagram of a Ciona tadpole showing the position of coronet cells (DA neurons [green]) and photoreceptor cells, including the ocellus and group III cells (magenta). (Right) Coronet cells visualized by a Ptf1a>CFP reporter gene (green) containing 5′ flanking regulatory sequences from Ptf1a and photoreceptor cells (magenta) visualized by immunostaining with an Arrestin antibody. (Oc) Ocellus; (Cor) coronet cells; (GIII) group III photoreceptor cells. (B) Schematic illustrating the workflow for single-cell RNA-seq analysis of Ciona embryos using the 10x Genomics Chromium system. (C) A t-distributed stochastic neighbor embedding (tSNE) projection map of mid-tail bud stage embryos highlighting the distribution of DA neuron marker genes (AADC, GCH, and SERT) and Ptf1a. Each dot corresponds to the transcriptome of a single cell. Red dots indicate DA neurons/coronet cells clusters, blue dots indicate CNS, and gray dots indicate other tissues.
