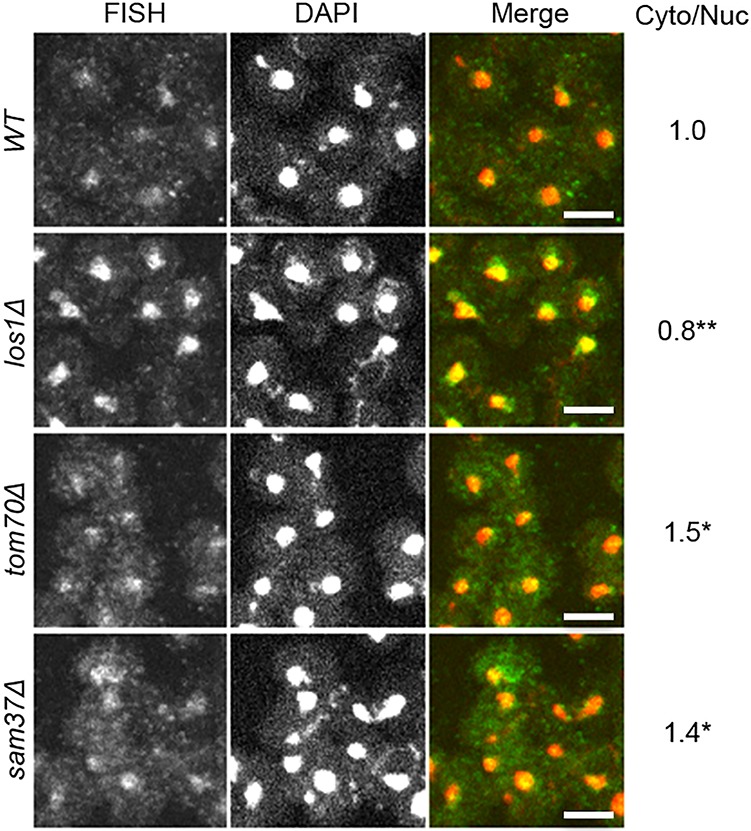
Figure 2.

S. cerevisiae tom70Δ and sam37Δ cells accumulate end-processed intron-containing tRNAs in the cytoplasm. FISH analysis of the subcellular localization of tRNAIleUAU using intron probe SRIM03 (green). Nuclei were visualized by DAPI staining (red). Bar, 4 µm. The average signal intensities from the cytoplasm and nucleus were obtained from 10 cells, and statistical analysis was performed from three biological repeats (Supplemental Fig. S2; Supplemental Material). The ratio between signal intensity of cytoplasm versus nucleus was calculated and normalized to wild type (Cyto/Nuc). (*) P ≤ 0.05; (**) P ≤ 0.01.
