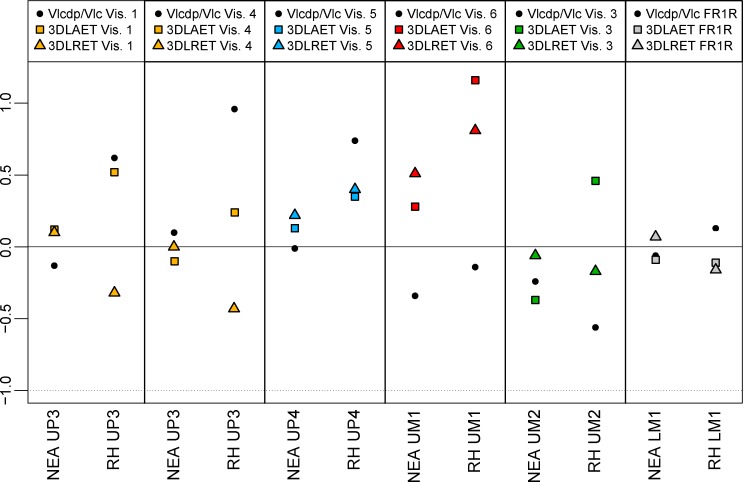
Fig 4. Adjusted Z-score graphs of the lateral crown tissue proportions variables (Vlcdp/Vlc, 3DLAET, 3DLRET) for the Vis. 1 and Vis. 4 UP3s, the Vis. 5 UP4, the Vis. 6 UM1, and the Vis. 3 UM2 from Visogliano, and for the FR1R LM1 from Fontana Ranuccio compared with similar evidence for Neanderthals (NEA) and extant humans (EH).
The full line passing through the zero represents the average and the dotted lines correspond to the estimated 95% limit of variation expressed for each group (NEA and EH). See the Table 1 for details on the composition of the comparative samples.

