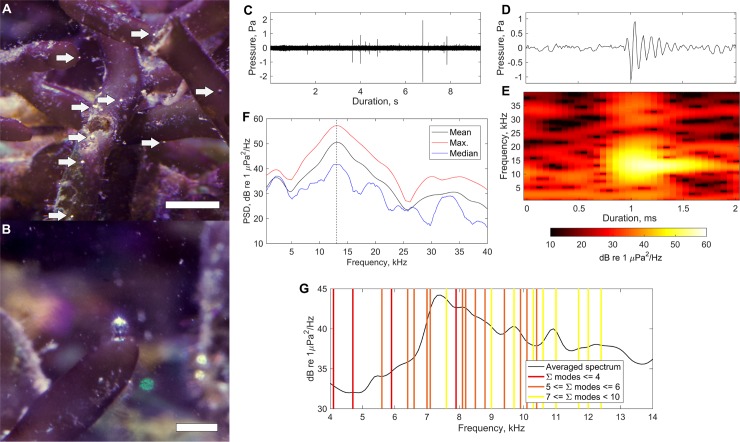
Fig 1. Characterization of bubble sound from algae.
(A) Gracilaria salicornia actively creating gas bubbles during photosynthesis. White arrows indicate the locations of larger bubbles. The scale bar is 5 mm in length (B) A closer view of one gas bubble about to detach from the algae surface. The scale bar is 2 mm in length. (C) A 9 s time series of ambient sound from inside the aquarium. (D) A high-resolution view of a typical transient waveform as shown in (C). (E) Spectrogram showing the time-varying spectral content of the received waveform in (D). (F) Pressure spectral density (PSD) estimates showing mean, median and maximum pressure spectral densities of received level from the 2 ms period as shown in (D) and (E), indicating the spectral peak of the waveform as 13.07 kHz (vertical dashed line). (G) An averaged spectrum from transient sounds recorded over one hour overlaid with standing-wave resonant tank modes. Mode sums indicate the sum of mode numbers in the horizontal (length, width) and vertical (depth) directions.

