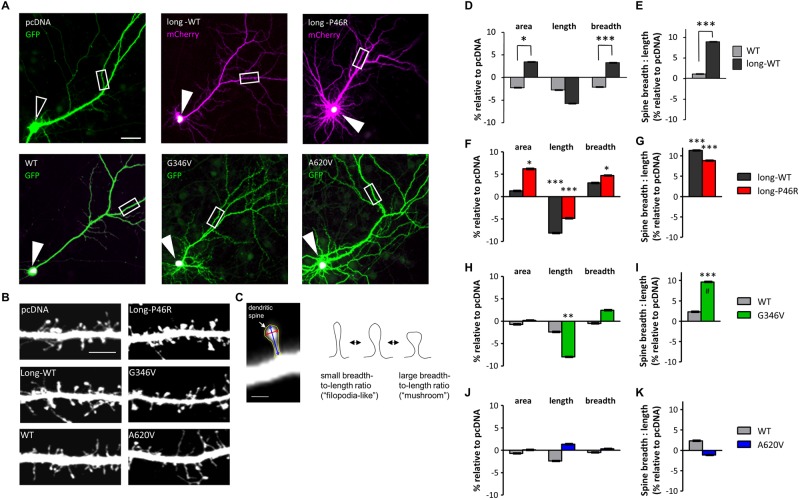
Fig 2. Effect of ZBTB20 and its variants on dendritic spine morphology.
(A) Overexpressed ZBTB20 protein localized to the nucleus. Low magnification (10x) images of neurons overexpressing GFP + control vector (pcDNA), mCherry + ZBTB20-long-WT (GFP-tagged), mCherry + GFP-ZBTB20-long-P46R (GFP-tagged), GFP + ZBTB20-WT (V5-tagged), GFP + ZBTB20-G346V (V5-tagged), or GFP + ZBTB20-A620V (V5-tagged). Expression of control vector shows no V5 signal (open arrowhead), while overexpression of ZBTB20 constructs shows localization of ZBTB20 signal to the soma, presumably the nucleus (closed arrowheads; white indicates overlay of green and magenta channels). White boxes indicate regions of dendrites shown at higher magnification in Fig 3B. Scale bar, 40 μm. (B) Representative images of dendritic segments from forebrain pyramidal neurons (DIV 26–28) overexpressing the indicated ZBTB20 constructs. Scale bar, 5 μm (see also Fig 3). (C) Dendritic spines of pyramidal neurons were analyzed in MetaMorph for their cross-sectional area (yellow outline), length (blue arrow), and breadth (red). The breadth of each spine divided by its length gives its breadth-to-length ratio and indicates the spine’s shape independent of its size. Smaller breadth-to-length ratios indicate a thin, “filopodia-like” morphology, whereas larger breadth-to-length ratios indicate a short but broad, “mushroom-like” morphology. Scale bar, 1 μm. Dendritic spine areas, lengths, and breadths (D, F, H, J) and spine breadth-to-length ratios (E, G, I, K) of neurons expressing indicated ZBTB20 constructs [ZBTB20-WT (N = 16), ZBTB20-long-WT (N = 16), ZBTB20-long-P46R (N = 15), ZBTB20-G346V (N = 14), or ZBTB20-A620V (N = 18)]. All spine parameters are shown relative to control pcDNA vector. Data represented as means ± s.e.m. *P < 0.05; **P < 0.01; ***P < 0.001; #P < 0.001, different from WT. Student’s t test, point variant compared to WT counterpart.

