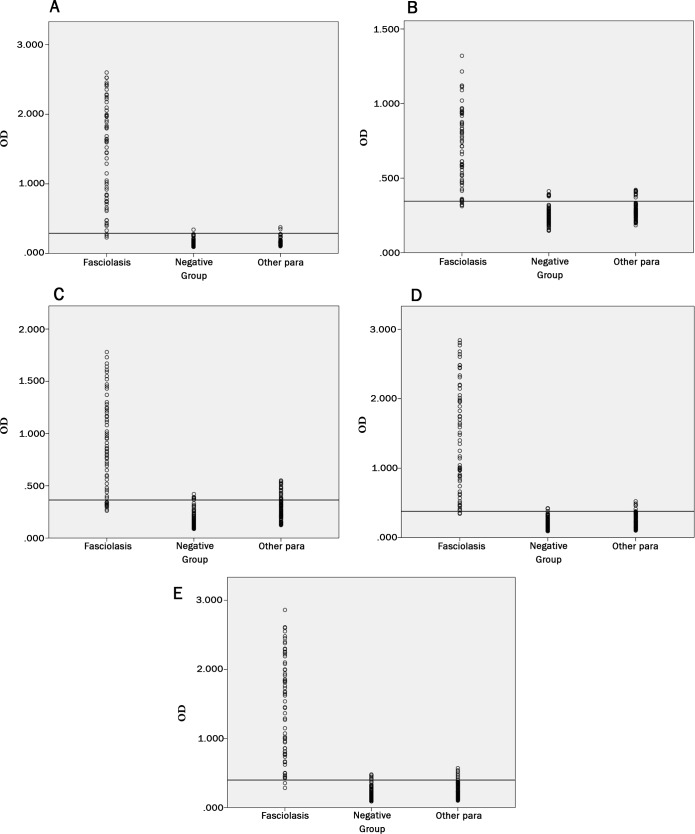
Fig 5. ELISA assay showing the reactivity of rtFhSAP-2, rtFhFtn-1, rFhLAP, and combination.
(A) Scatter of rtFhSAP-2 ELISA absorbance value. (B) Scatter of rFhLAP ELISA absorbance value. (C) Scatter of rtFhFtn-1 ELISA absorbance value. (D) Scatter of combination ELISA absorbance value. (E) Scatter of E/S ELISA absorbance value, Horizontal line indicates the cutoff value established in both assays.

