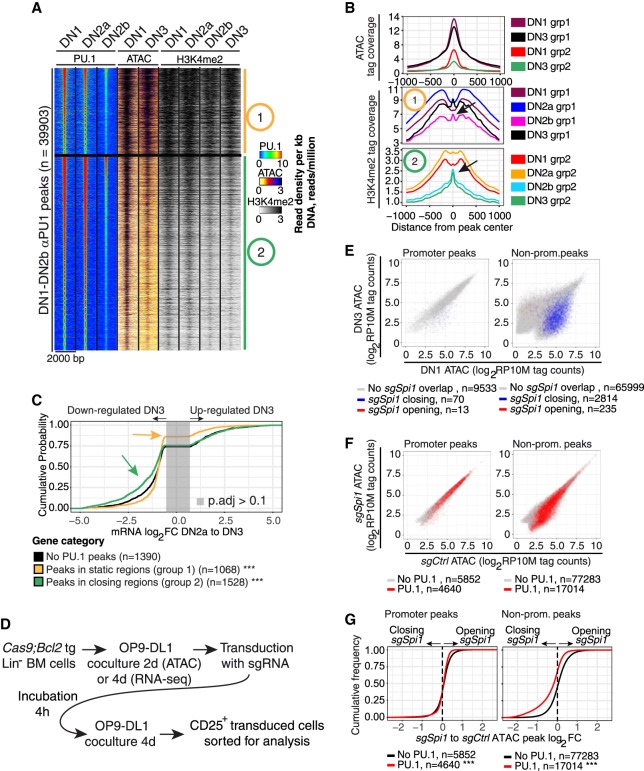
Figure 2.
PU.1 loss reduces chromatin accessibility at nonpromoter sites. (A) Heatmap of PU.1 and ATAC tag count distribution in early DN-pro-T development. Regions 2-kb wide were k-means clustered (k = 2) based on PU.1 binding, ATAC, and H3K4me2 patterns. Group 1: constitutively open sites. Group 2: sites losing accessibility from DN1 to DN3. (B) ATAC and H3K4me2 distributions at the indicated stages at sites in Groups 1 and 2. Arrows in the H3K4me2 plot: nucleosome reconstitution after PU.1 loss. (C) Natural changes in gene expression across commitment (DN2a to DN3, genes changing with P.adj < 0.1) linked to Group 1 (static) and 2 (closing) sites: (***) Kolmogorov–Smirnov P-value ≤0.0001 relative to genes without PU.1 peaks. (D) Schematic of protocol for CAS9-mediated disruption of PU.1 using transduction with sgSpi1 or control guide RNAs. (E) Effects of disruption of PU.1 in DN2 cells on accessibility of promoter and nonpromoter sites: (x-axis) ATAC accessibility of individual sites in DN1 stage; (y-axis) accessibility in DN3 stage; (blue) sites that lose accessibility upon PU.1 deletion in DN2 cells; (red) sites that gain accessibility (rare). (F) Enrichment of PU.1-binding sites among genomic sites that lose ATAC accessibility upon PU.1 deletion. ATAC accessibility of genomic sites after PU.1 deletion (y-axis) is plotted against their accessibility in controls (x-axis): (red) sites overlapping with PU.1 binding in DN1, DN2a, and/or DN2b cells. (G) Effects of PU.1 knockout on accessibility of promoter and nonpromoter PU.1 binding sites: (***) Kolmogorov–Smirnov P-value ≤0.0001.

