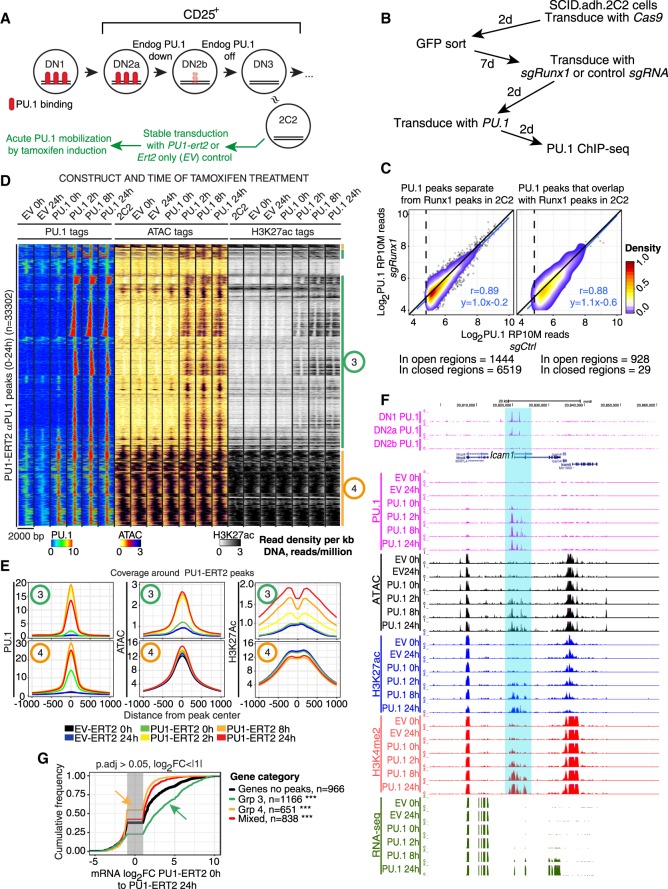
Figure 3.
Induction of PU.1 activity leads to chromatin opening, altered histone modifications, and cis-regulatory element-dependent gene activation. (A) Schematic showing approximate relationship of Scid.adh.2C2 cells to normal program of T-cell development, with experimental plan for panels D–G. (B) Schematic of test in Scid.adh.2C2 cells to determine whether exogenous PU.1 site binding is RUNX1-dependent. (C) Results of protocol shown in B. PU.1 occupancy scores for PU.1 binding in cells after Runx1 disruption (y-axis) are plotted against scores for PU.1 binding in controls (detected with αPU.1). Sites are stratified according to their ATAC accessibility and RUNX1 occupancy in unmanipulated Scid.adh.2C2 cells (Hosokawa et al. 2018). Pearson's r and linear trend lines are shown for peaks with a peak score (Homer findPeaks) greater than 30 in controls. (D) Time courses of PU.1 binding, induced changes in chromatin accessibility, and histone H3K27 acetylation after 0–24 h of mobilization by 4-hydroxytamoxifen (4-OHT), in Scid.adh.2C2 stably transduced to express PU1-ERT2 or EV-ERT2. Sites in heatmap were hierarchically clustered on Pearson correlation with average linkage. Shown are manually derived groups of sites that open and gain H3K27ac upon PU1-ERT2 mobilization (Group 3) or that are already open and associated with H3K27ac at 0 h (Group 4). (E) Quantitative distribution plots of PU.1, ATAC, and H3K27ac signals within 1 kb of Groups 3 and 4 PU.1 bound sites. (F) PU.1 binding to the positively regulated Icam1 gene in DN1-DN2b cells (top) and samples from the time course shown in D. Highlight indicates chromatin regions opened by PU.1 binding prior to RNA expression. (G) Association of PU1-ERT2 binding site Groups 3 and 4 with changes in linked gene expression between 0 and 24 h of 4-OHT induction: (***) Kolmogorov–Smirnov P-value ≤0.0001.

