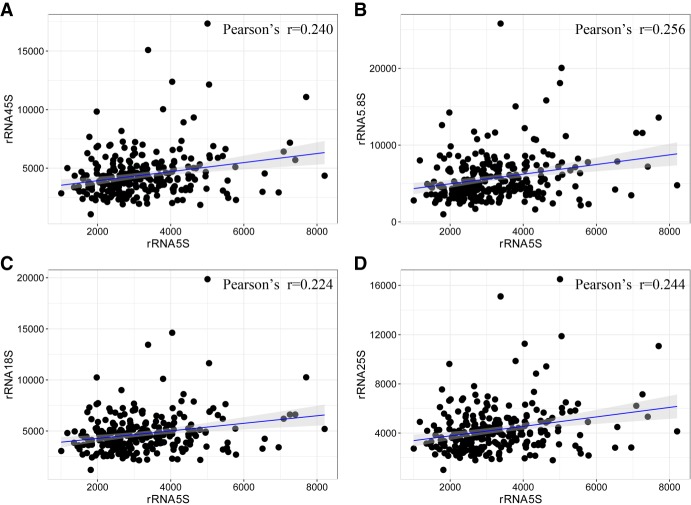
Figure 2.
Evidence for the coevolution of 5S with 45S rRNA. (A) Correlation analysis between the CN of 5S and 45S rRNA (P-value = 0.0001). (B–D) Correlations between the CN of 5S and three components of 45S, including 5.8S (P = 3.366 × 10⁻⁵), 18S (P = 0.0003), and 25S (P = 7.942 × 10⁻⁵). The population size was n = 256, and r is the Pearson's coefficient.

