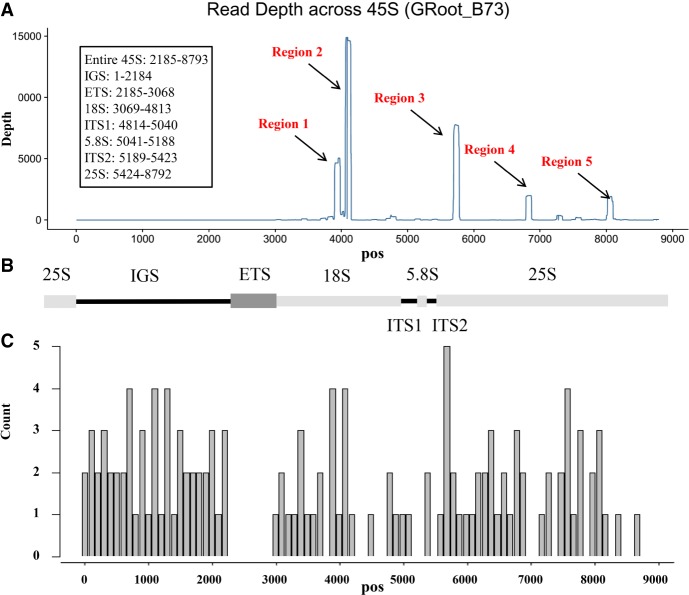
Figure 3.
45S rRNA can be sequenced by 3′mRNA-seq. (A) 3′mRNA-seq data (from one B73 GRoot sample) mapped on the maize 45S rDNA reference sequence shows five obvious peaks. Each peak represents a region that could be highly amplified using poly(T) primers and sequenced. A higher peak indicates more reads generated from these regions, implying higher reverse transcription efficiency. (B) The entire 45 rDNA gene locus with intergenic spacer region (IGS). (C) The bar plot indicates the frequency of the poly(A)-like motif across the 45S region. The y-axis represents the count of the motif.

