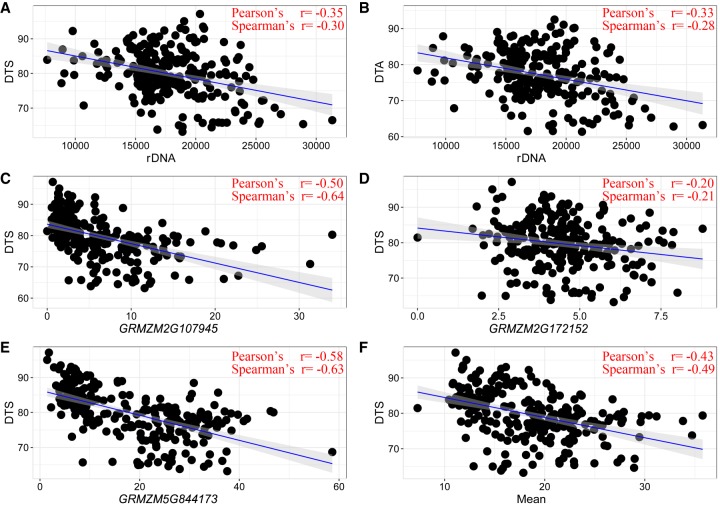
Figure 8.
Flowering time is negatively correlated with the rDNA expression level and the coexpressed gene expression level among maize 282 panel (comprising 244 inbred lines). (A,B) Correlation between rDNA expression and best linear unbiased predictions (BLUPs) for days to silk (DTS) and days to pollen shed (DTA). The x-axes represent the CN of rRNA, and the y-axes represent phenotype measurements (BLUPs). (C–F) Correlation between BLUPs for DTS and three genes, and the mean expression value of 22 negatively correlated genes. The x-axes represent the RPM of individual genes, and the y-axes represent phenotype measurements (BLUPs).

